The Worst Out-of-State Drivers In Your State
While on a vacation or passing through, a bad driver from another state is involved in a car accident – it may sound like the start of a joke, but the facts behind it are no laughing matter. Out-of-state motorists are in numerous deadly accidents every year, each sparking untold devastation and loss for all involved.
To find out more about which states’ licensed drivers are involved in accidents resulting in fatalities, we culled data from the National Highway Traffic Safety Administration’s Fatality Analysis Reporting System (FARS). Which drivers are the most accident-prone in the country? Which out-of-town motorists are involved in the most fatalities in your state? And how do drivers from your state stack up to those in the rest of the country when it comes to fatalities? We steer you through the stats below.
Mapping Accident-Prone Drivers
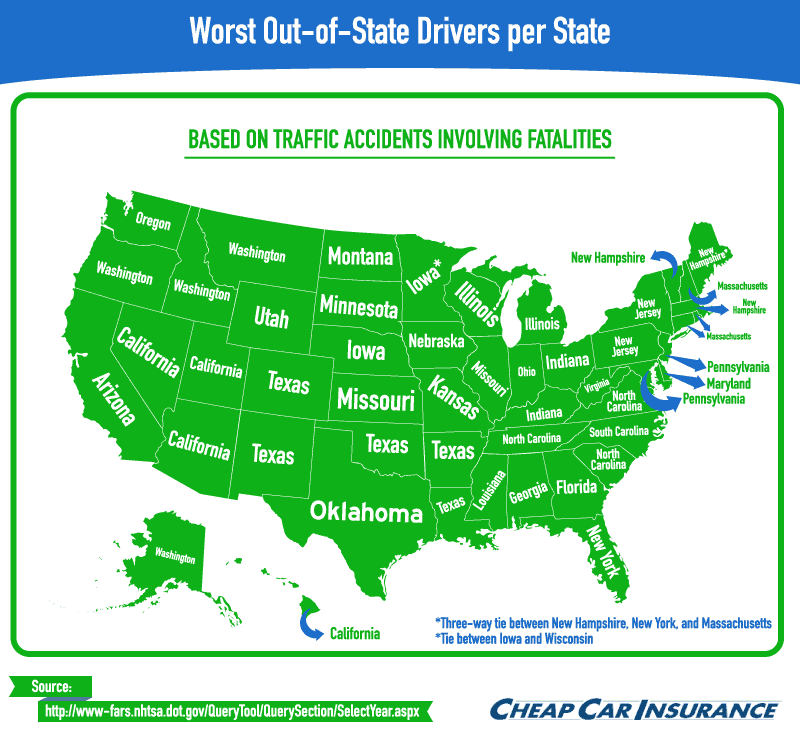
A glance at the map of accident-prone drivers based on number of fatalities reveals some interesting trends. Some states’ statistics are predictable – after all, most people naturally drive more often in neighboring states rather than faraway ones – but several surprises stand out. Among out-of-state drivers, Texans top the list for involvement in deadly crashes in a whopping five states. Washington state residents are most accident-prone in all their neighboring states, as are drivers from New Hampshire.
But proximity isn’t everything: New Yorkers are involved in more deadly crashes (based on number of fatalities) than any other out-of-state drivers all the way down in Florida. Texans are involved in tragic accidents in all four neighboring states, along with topping the list in Colorado. Illinois drivers are the most accident-prone visitors in three states, including non-neighbor Michigan.
Worst Drivers by State
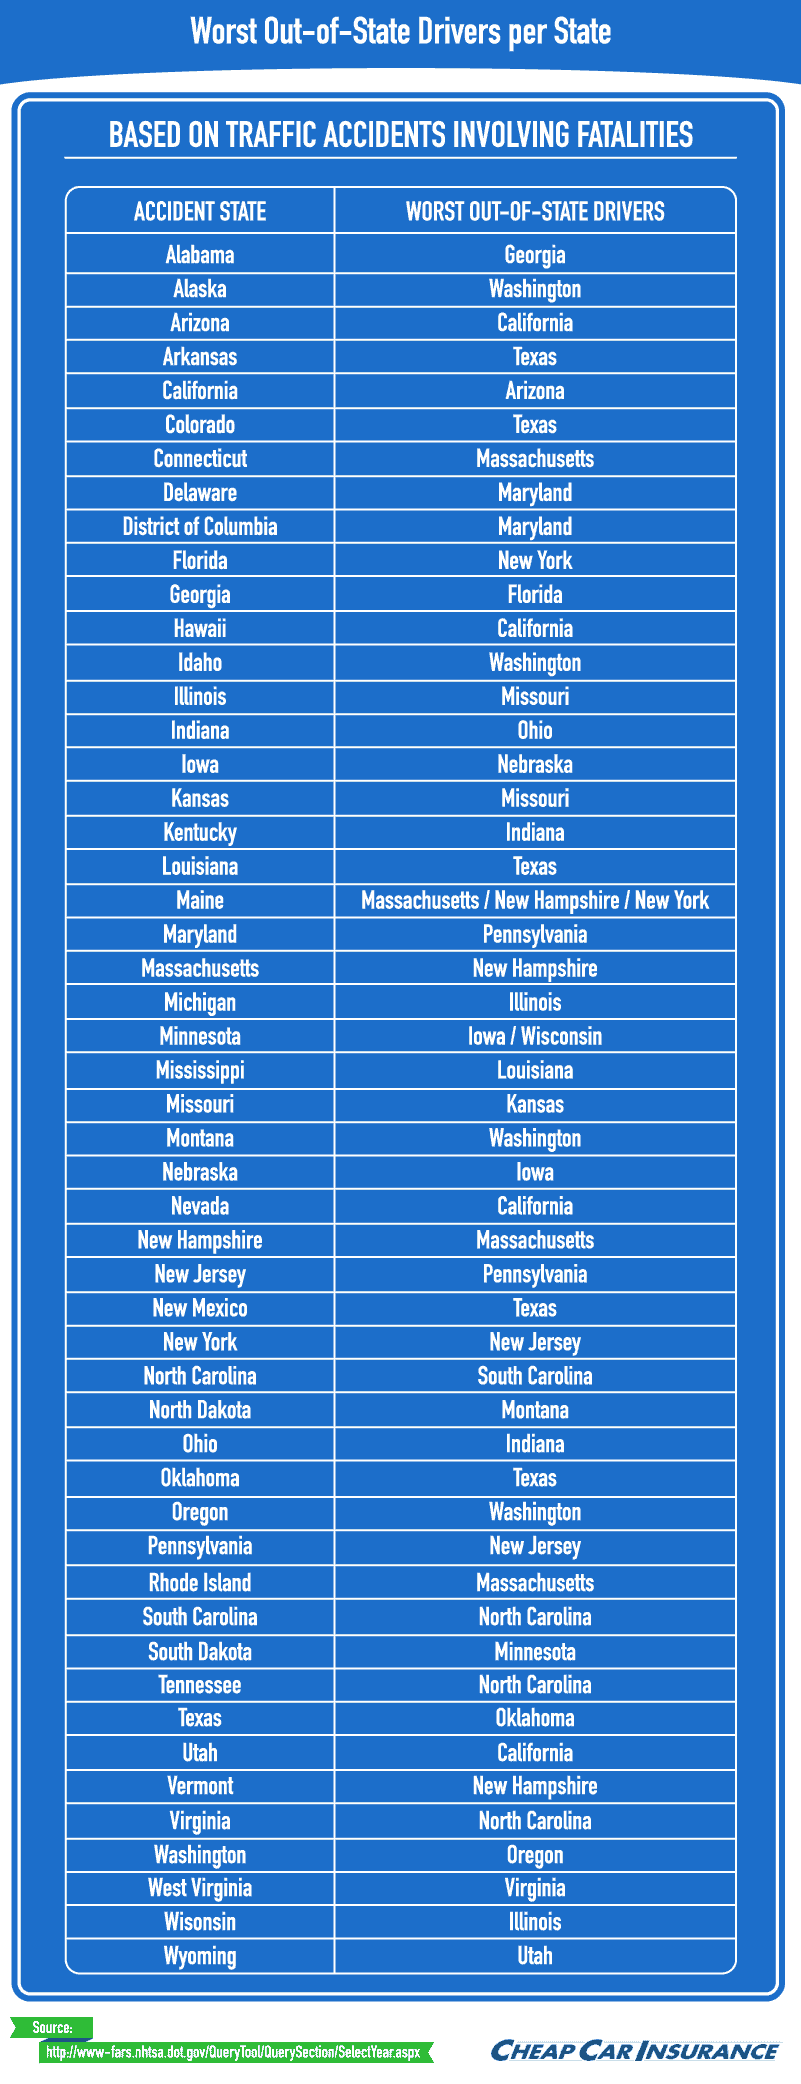
The graphic above offers a comprehensive look at which out-of-state drivers are involved in the highest number of fatal accidents in each state. Check the chart to see who the riskiest drivers are in your state.
Various factors contribute to fatal accidents –lighting conditions, road types and designs, drug or alcohol use, and distracted driving are all prevalent. In fact, it’s now estimated that a quarter of crashes, including non-fatal ones, involve cell phone use. But driving in a different state can add an additional layer of risk thanks to less familiar terrain, weather, and even certain road features, such as roundabouts.
Also, out-of-state drivers may be more prone to speeding or other infractions knowing that punishments are more difficult to enforce – after all, the threat of license suspension disappears for motorists who don’t hold that state’s license. In Georgia, for instance, around three-quarters of unpaid revenue from “Super Speeder” (extremely high speed) infractions is due from out-of-state motorists.
Accident-Prone Drivers Ahead
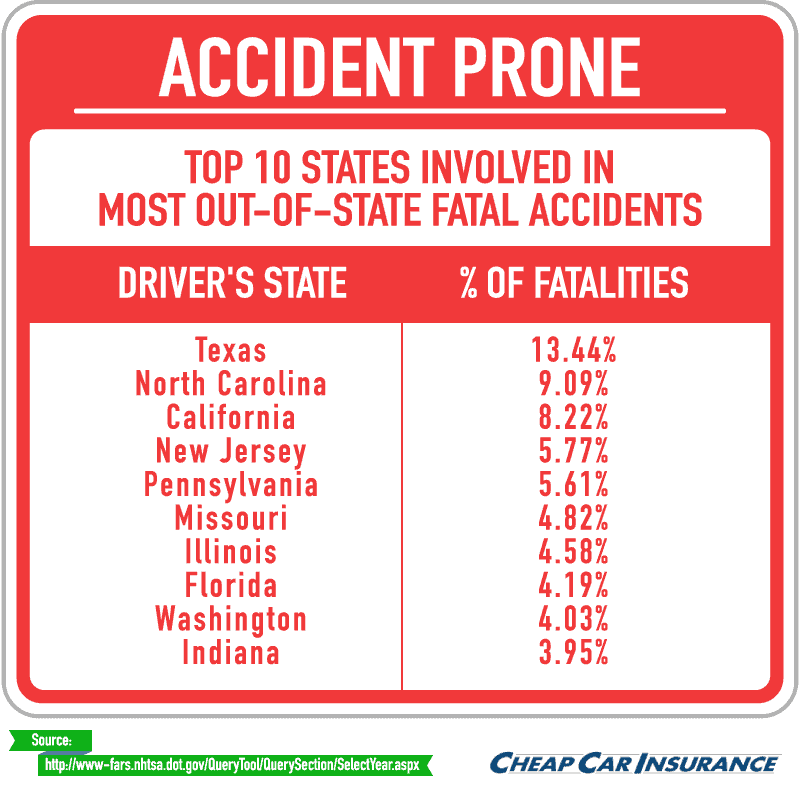
Accident-prone drivers reside from coast to coast, but motorists from the Lone Star State seem to crash more than their fair share: More than 13 percent of auto accident deaths across the country occur in crashes involving Texans. Though Texas’s large population is surely a factor, one recent study revealed that three-quarters of Texas drivers admit they sometimes talk on their cells while driving, while almost half admit they read or text while driving.
Though on opposite coasts, North Carolina and California motorists are involved in accidents in which 9 and 8 percent of accident fatalities occur, respectively. Of the Northeastern states, Pennsylvania and New Jersey drivers appear most likely to get in deadly crashes. And Missouri, Illinois, and Indiana represent a swath of accident-prone drivers across the Midwest.
Which region is home to drivers who are least often involved in crashes? Excluding California and Washington, no state in the West makes the top 10 for accident-prone states. Southeastern drivers also appear less likely to crash, save for North Carolina and Texas.
Who’s the Worst Driver In Your State?
See where your state ranks by clicking the interactive graphic to reveal the percentage of fatalities each state’s motorists cause in every state. To the right of the graphic, you can see what percentage of out-of-state fatalities drivers from each state are involved in. The most surprising takeaways? In D.C., Maryland drivers are involved in more than 45 percent of fatalities from crashes; Massachusetts motorists are involved in more than 12 percent in Rhode Island; and Montana drivers are in more than 10 percent of deadly accidents in North Dakota.
In Texas – where residents get in the most deadly crashes in other states – no visiting state made up more than 1 percent of fatalities caused by crashes: Drivers from Oklahoma, California, and New Mexico were involved in 3/4 percent of fatalities apiece. California was similar: The top three deadly crash–prone states (Arizona, Nevada, and Oregon) comprised less than 2 percent of fatalities combined.
Conclusion
Driving in a different state can pose a unique challenge – whether you’re white-knuckling through an unfamiliar city or trying to avoid lead-foot syndrome on a desolate highway stretching across a seemingly endless state. The information above reveals a startling snapshot of which states’ drivers are involved in a disproportionate number of deadly crashes. So how can Americans stay safe on the roads? Certain factors could help reduce risk, from enhanced driver education to safety campaigns conducted by law enforcement. On a personal level, you can reduce your crash risk by ensuring you don’t drink and drive, don’t drive distracted, and don’t speed – whether you’re sticking close to home or navigating an unfamiliar state.
Methodology
FARS classifies a deadly crash as any incident in which a vehicle’s motion causes a fatality. The database offers data on the drivers involved in the accidents as well as the locations of the fatal accidents. We collected information for 44,574 accidents that occurred in 2013 and analyzed the reported accident state and license state of the drivers. We excluded instances in which accident state and driver state were the same.
Sources
http://www.rita.dot.gov/bts/sites/rita.dot.gov.bts/files/subject_areas/safety/vehicle_fatality
http://www.nsc.org/NewsDocuments/2014-Press-Release-Archive/3-25-2014-Injury-Facts-release.pdf
http://archive.burlingtonfreepress.com/article/20130401/NEWS02/304010004/UVM-study-visitors-are-more-likely-than-Vermonters-to-be-at-fault-for-car-crashes
http://www.myajc.com/news/news/state-regional-govt-politics/out-of-state-super-speeders-ignore-georgias-limits/npKh2/
http://www.texastribune.org/2014/04/21/study-most-texans-drive-and-talk-many-text/
http://www.sciencedirect.com/science/article/pii/S0386111211000021
http://www.wkyt.com/wymt/home/headlines/Police-start-new-campaign-to-prevent-deadly-car-crashes-282327631.html
http://www.consumerreports.org/cro/news/2015/04/6-ways-to-avoid-a-car-accident/index.htm
http://www-fars.nhtsa.dot.gov/QueryTool/querysection/selectyear.aspx
Fair Use
Feel free to reuse any of the assets found in this project. When doing so, we ask that you please link back to Cheap Car Insurance and this page to give your readers a chance to explore our full report and the data behind it.
