Behind the Wheel: Driving by Demographic

In 2014, 32,675 people died in motor vehicle crashes in the U.S. – and it appears that rate is only increasing. Every time you get behind the wheel, you have the potential to affect the lives of everyone else on the road. That’s why it’s vital to be the best driver possible. We’ve all heard the clichés about the skill levels of certain drivers, whether based on gender, race, or age. But in terms of these potentially offensive stereotypes, how much of the hype is even true?
To separate fact from fiction when it comes to accident-prone drivers, we gathered information from the National Highway Traffic Safety Administration’s Fatality Analysis Reporting System (FARS). How do the driving behaviors of people of different genders, races, and ages compare in terms of involvement in deadly accidents? And which states are home to the riskiest drivers? Keep reading to get the facts.
Risky Driving Behavior by Gender
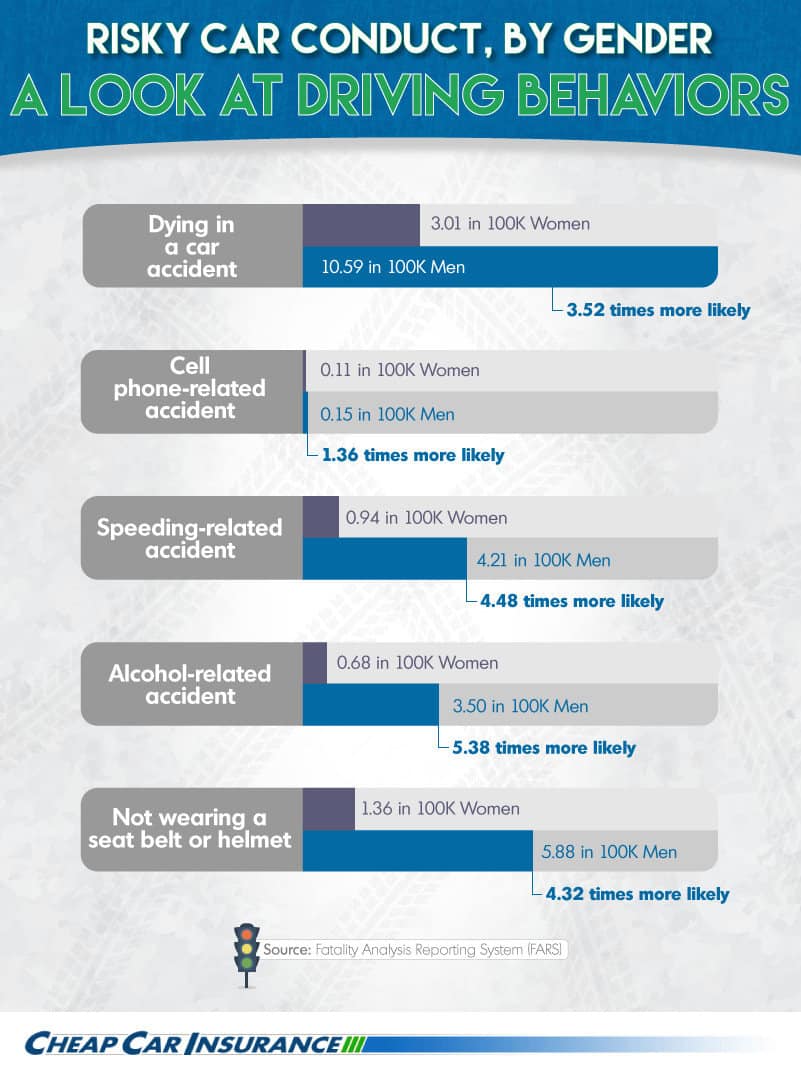
Have you ever heard someone crack a joke about women drivers? The above graphic reveals some telling facts that contradict this often-heard critique: Men are more than five times likelier to get in an alcohol-related accident, almost 4.5 times more apt to get in a speeding-related accident, and nearly 1.4 times likelier to get in a cellphone-related accident. Men are also more than 4.3 times likelier to forgo safety measures (seat belts in a car and helmets on a motorcycle). The result of this risky behavior? Men are more than 3.5 times likelier than women to die in a motor vehicle accident.
Risky Male Drivers by State
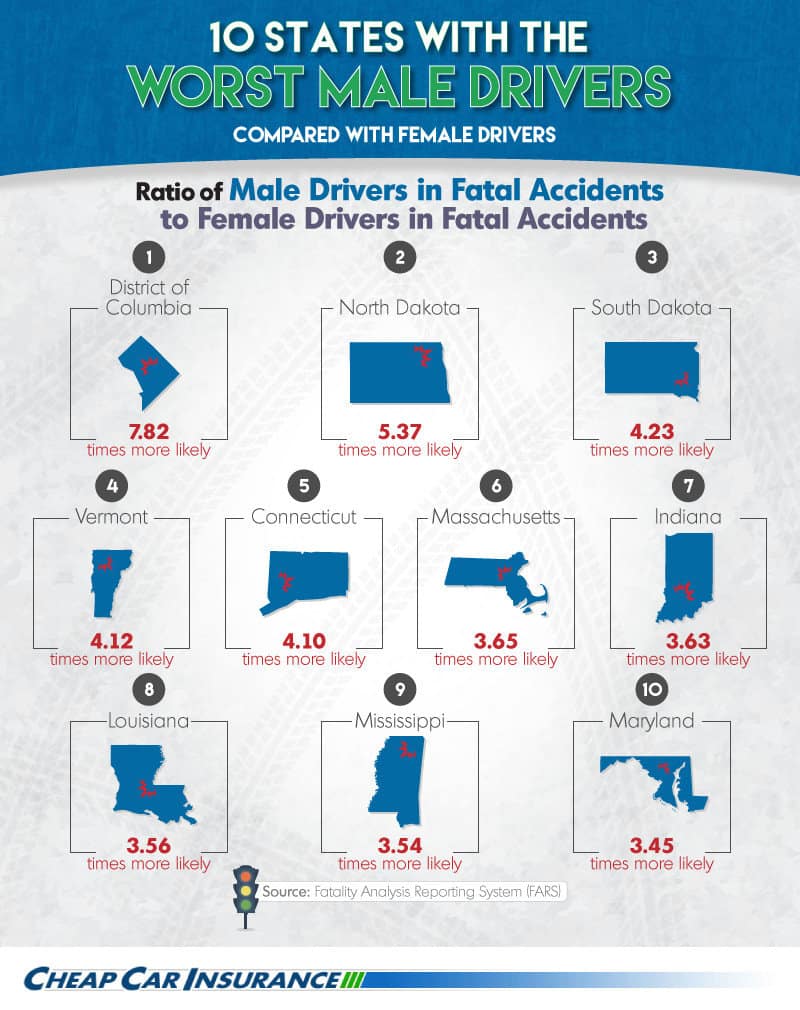
Overall, men are more likely than women to be involved in fatal accidents – and in some states, the difference is staggering. In Washington, D.C., male drivers are nearly eight times more apt to get in a fatal crash than female drivers. Additionally, men are over five times likelier to get in a deadly accident in second-place North Dakota and over four times likelier in South Dakota, Vermont, and Connecticut.
Accident-Prone States by Gender

Fatal accidents can occur across the country, but the states in the graphic above see more than their fair share. Wyoming tops the charts for deadly accidents involving men and women: More than 46 per every 100,000 male residents are involved in fatal crashes, and over 19 per every 100,000 female residents are. Why? Its low population contributes to a high “per 100,000” rate, long distances can make it difficult for accident victims to receive timely medical attention, and officials report that many Wyoming drivers don’t use seat belts.
South Dakota takes second place for crashes involving women as well as fifth place for accidents involving men. North Dakota, Mississippi, and Oklahoma also make the top 5 for men, while Alabama, Montana, and Tennessee round out the top 5 for women.
Mapping Fatal Accidents by Gender
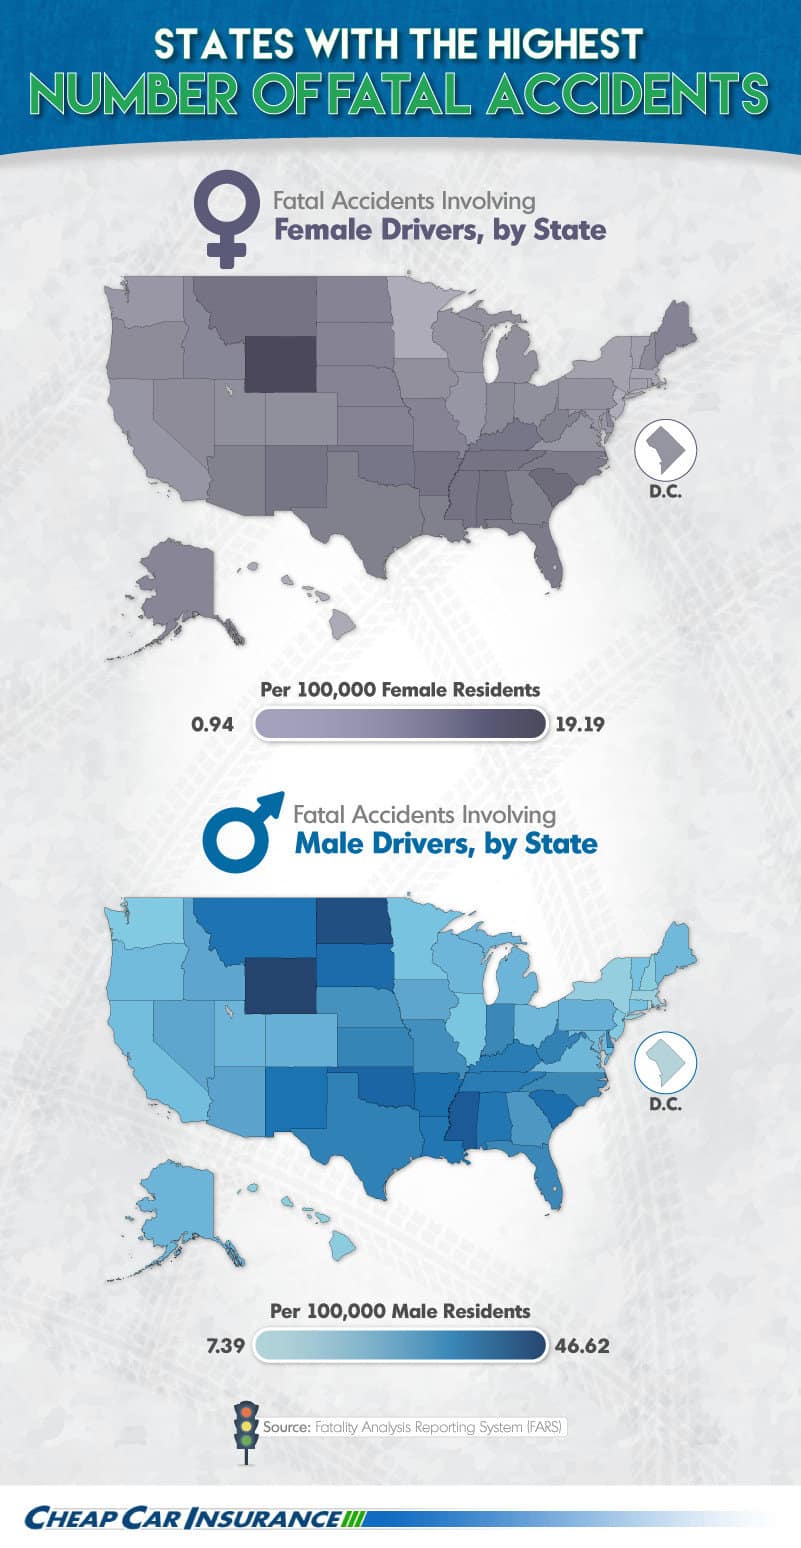
Comparing the maps of the highest number of fatal accidents involving either men or women paints an interesting picture. Overall, men are involved in many more deadly accidents than women. Some states show similarities – Wyoming is the top state for both genders, although men get in over twice as many fatal crashes. However, in North Dakota, the second-place state for male drivers, men average nearly 44 fatal accidents per 100,000 male residents, while women average only eight per 100,000 female residents. South Carolina takes second place for women, with almost 13 deadly crashes on average. On the other end of the spectrum, men in Washington, D.C., average just over seven deadly accidents, while women are involved in fewer than one.
Mapping Alcohol-Related Fatal Accidents
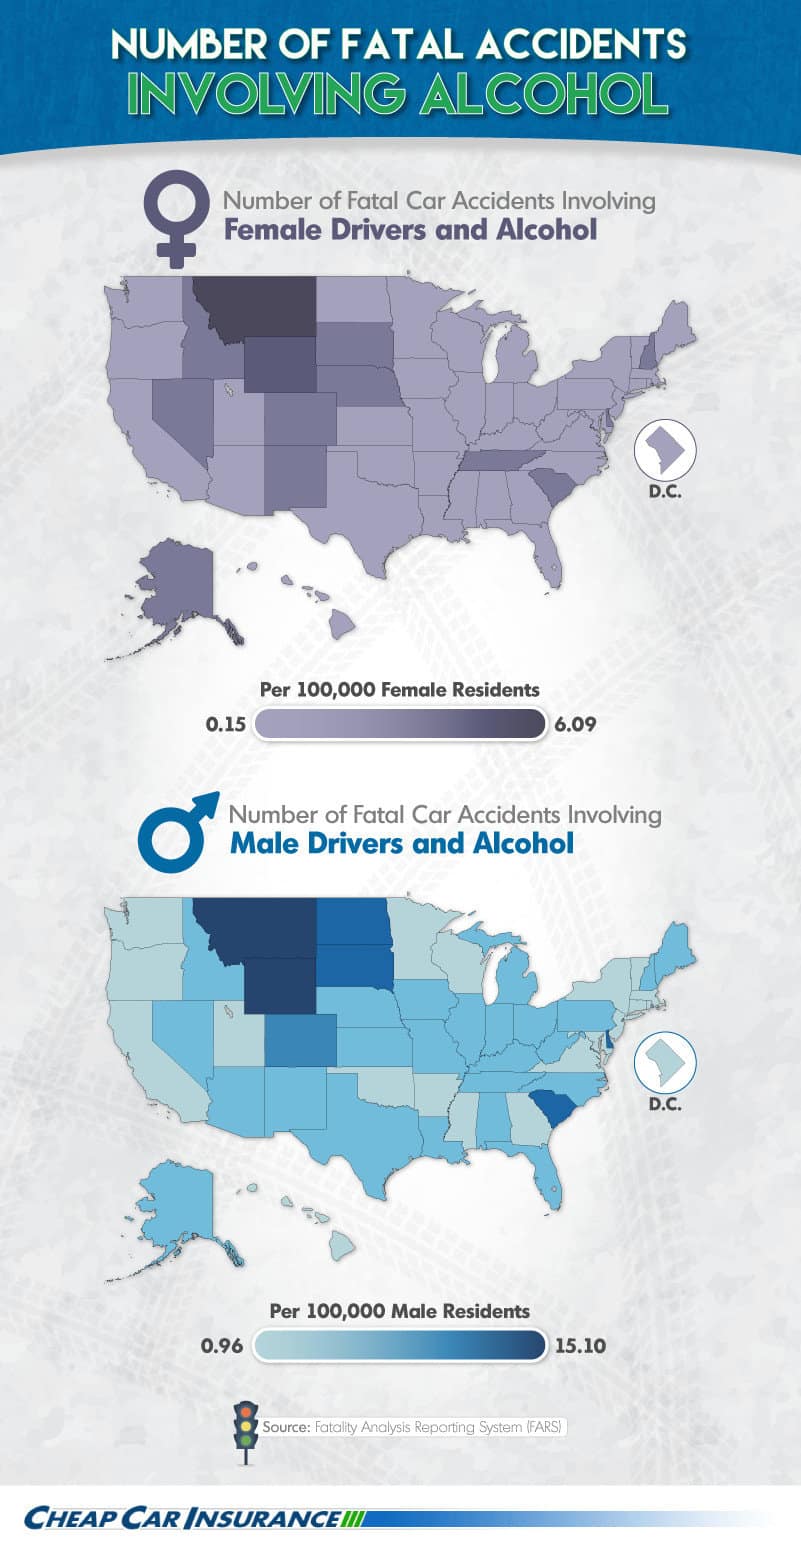
The map above focuses on fatal accidents that involve alcohol consumption. For both genders, Montana is the top state for these types of crashes: Men average over 15, while women get in just over six. Wyoming comes in second, with just over four accidents for women and nearly 12.5 for men. As for states with the fewest alcohol-related deadly crashes, New York saw fewer than one for men and Minnesota saw fewer than 0.2 involving women.
Mapping Speeding-Related Fatal Accidents
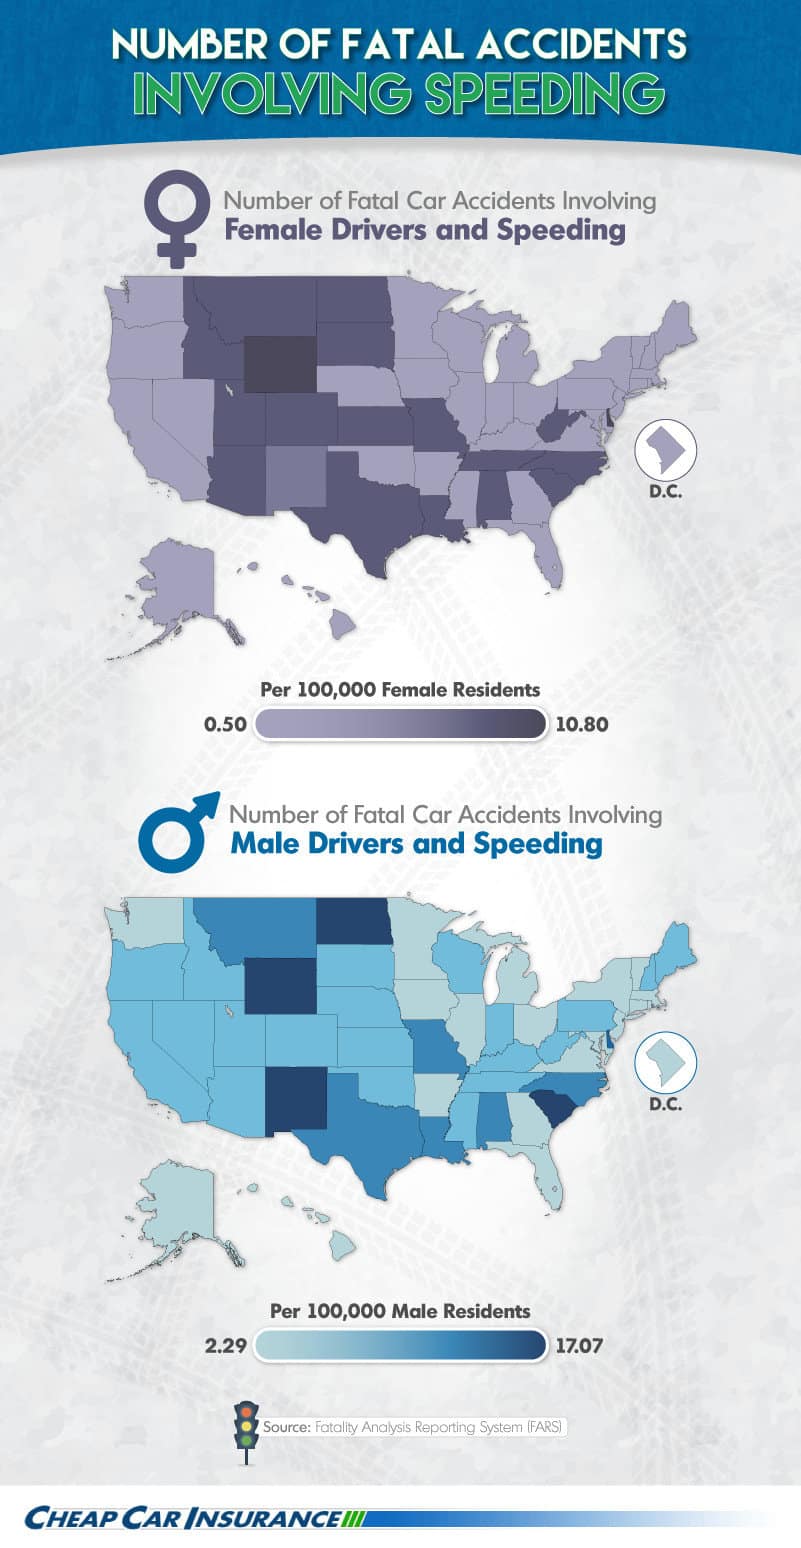
The above map zooms in on deadly accidents that involve speeding. Delaware is the No. 1 state for speeding-related fatal accidents that involved women, with almost 11 per 100,000 residents. Wyoming takes second place, with almost 10. When it comes to men and speeding, North Dakota claims the top spot with 17 accidents, followed by Wyoming (16) and New Mexico (almost 14.5). On the other hand, Massachusetts saw the fewest accidents for women, while Virginia had the fewest involving men.
Women’s Fatal Accidents by Race
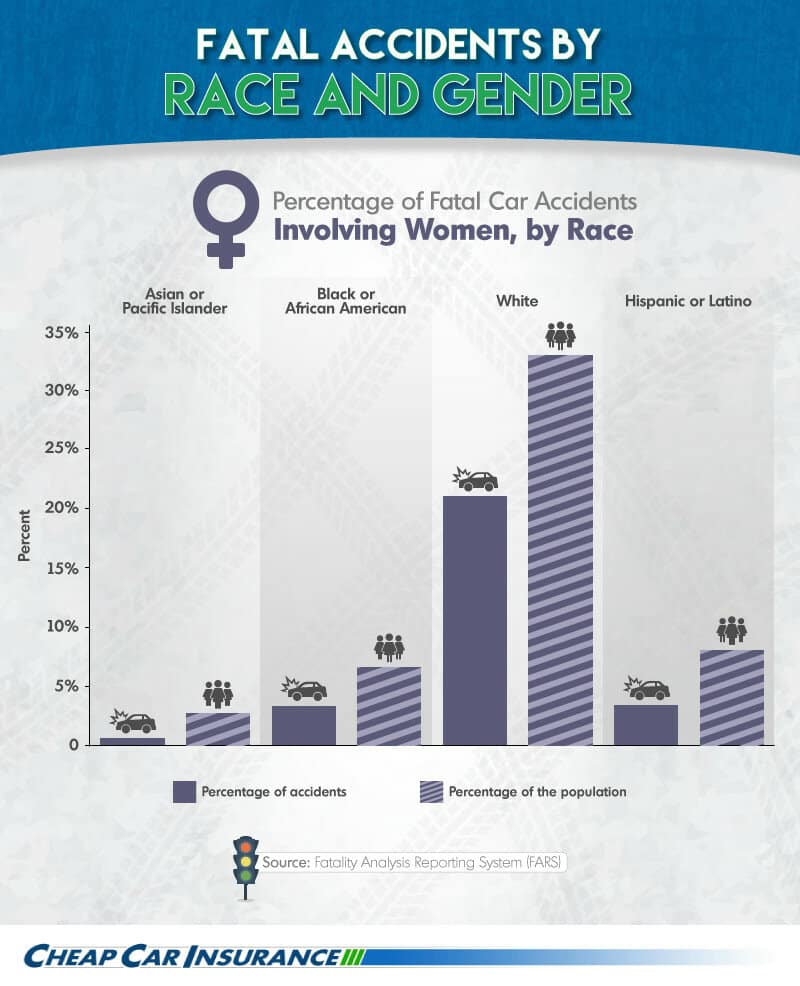
The graphic above provides a racial breakdown of women who are involved in deadly accidents. It appears that the stereotypes about certain minority drivers do not ring true. Asian/Pacific Islander women are involved in the lowest percentage of deadly accidents in proportion to their representative population. Proportionally, white women are involved in the highest percentage of fatal crashes, followed by black/African American women and then Hispanic/Latino women.
Men’s Fatal Accidents by Race
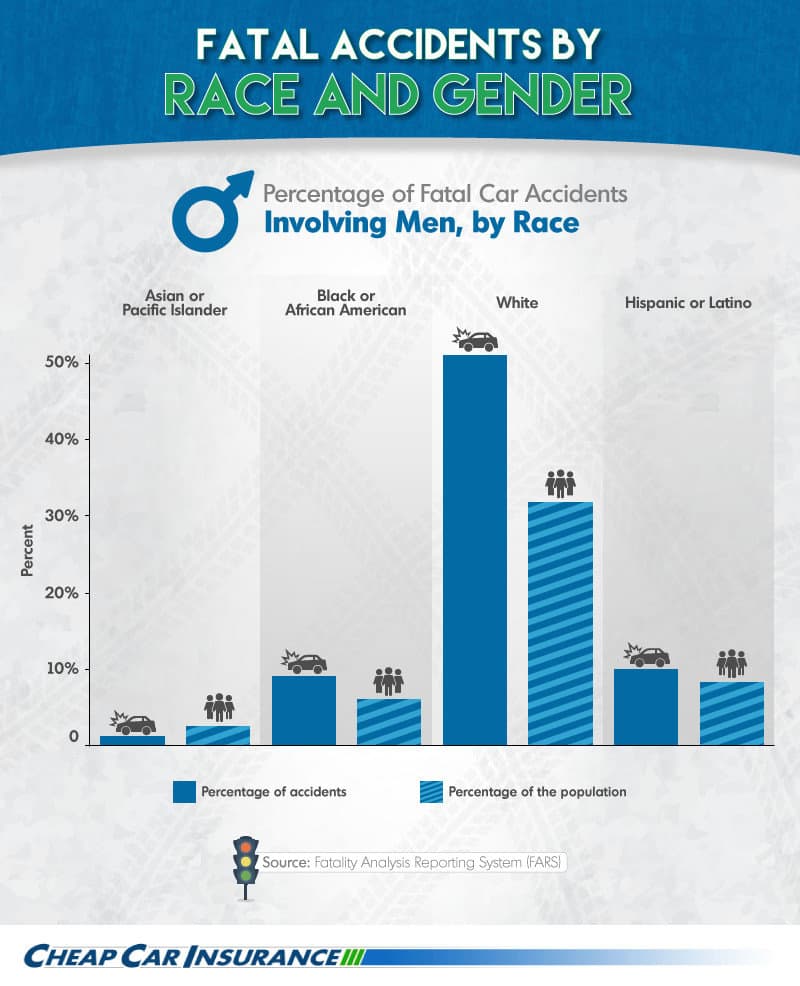
Breaking down the races of men involved in fatal accidents (based on each group’s population proportion) reveals a similar snapshot to the involvement of women: White men are involved in a much higher percentage of fatal crashes than any other group. Black/African American men come in second, followed closely by Hispanic/Latino men. Again, Asian/Pacific Islander drivers show the lowest involvement.
Driving Behaviors by Race
Conclusion
Driving is serious business – and it turns out that stereotypes about certain drivers are unfounded and certainly nothing to joke about. Our research offers a surprising glimpse of drivers’ involvements in fatal accidents broken down by gender and race.
Across the country, men are involved in more fatal crashes than women. Male drivers not only typically drive more miles, but they also tend to engage in risky behavior more frequently. Unfortunately taking certain risks can spell the difference between life and death – so it’s vital to obey road rules, utilize safety features such as seat belts and helmets, and never drive while distracted or under the influence of alcohol.
Methodology
The Fatality Analysis Reporting System (FARS) classifies a deadly crash as one in which a vehicle’s motion causes a fatality. We downloaded FARS 2014 raw data rather than using the querying tool, as it contains a wider set of criteria for driving behaviors such as speeding, the presence or use of alcohol, and cellphone use. The data pulled in this analysis will vary from the data pulled using similar variables in the querying tool due to the differences in criteria mentioned above. We collected information for fatal car accidents that occurred in 2014 and conducted the analysis in STATA using the “person,” “vehicle,” and “violation” files. We recoded “sex” in STATA so that our new variable only included “male” and “female”; it ignored records for “not reported” and “unknown.” For information on drivers, we looked at only “seat_position 11,” or the driver’s seat. The variables used for driving behaviors were: “mviolatn” (violations charged), “mdrdstrd” (driver distracted by), and “rest_use” (restraint system/helmet use). They were recoded as follows:
Drinking = 1 (yes, drinking was involved) if mviolatn = 11, 12, 13, 14, 15, 16, 19
Speeding = 1 (yes, speeding was involved) if mviolatn = 21, 22, 23, 24, 25, 26, 27
Cellphone = 1 (yes, cellphone use was involved) if mdrdstrd = 05, 06, 15
Seatbelt = 1 (no, no seatbelt or helmet was worn) if rest_use = 07
Variables concerning race were recoded as follows:
White = 1 if race = 01
Black = 1 if race = 02
Asian = 1 if race = 04, 05, 07, 18, 28, 48, 68
Hisp_rec = 1 if Hispanic = 01, 02, 03, 04, 05, 06
More information on the variables used can be found in the FARS User Guide 2014.
For our per capita calculations, we used Census 2010 data and for the “more likely to” calculations, we divided the male per capita calculations by the female per capita calculations, excluding instances that did not report the gender of the driver.
Sources
- http://www.nhtsa.gov/About+NHTSA/Press+Releases/2015/2014-traffic-deaths-drop-but-2015-trending-higher
- http://www-nrd.nhtsa.dot.gov/Pubs/812240.pdf
- http://www.wyomingnews.com/news/fatal-crashes-increase-in/article_385859e9-9f49-5b0f-9d86-72f0dea20310.html
- http://www.iihs.org/iihs/topics/t/general-statistics/fatalityfacts/gender
- ftp://ftp.nhtsa.dot.gov/fars/2014/DBF/
- ftp://ftp.nhtsa.dot.gov/fars/FARS-DOC/USERGUIDE-2014.pdf
Fair Use
Feel free to share the images found on this page freely. When doing so, please attribute the authors by providing a link back to this page, so your readers can learn more about this project and the related research.
