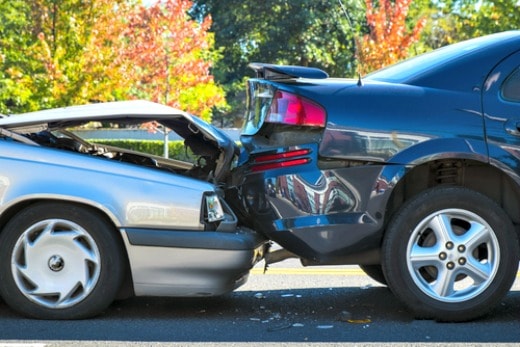
Nobody likes getting into a car accident. From the high-pitched screech of tires to the thunderous sound that comes when two cars slam together, the entire experience can jolt you to the core.
Even the smallest of crashes – a fender bender – can shatter your nerves for the rest of the day.
According to a U.S Census’s Motor Vehicle Accidents and Fatalities report, on average, there are 6 million car accidents in the United States. But how many of those accidents are really accidents?
Right now, as your eyes glide across the words in this article, someone is planning a staged accident. Seasoned swindlers – including unethical doctors and lawyers – have formed crime rings that bilk insurance companies out of billions of dollars each year through staged accidents.
Insurance companies are not the only ones getting ripped off. Consumers also pay the price of staged accidents by way of rising insurance premiums. What’s worse, staged accidents are just a lead-in to other forms of auto insurance fraud.
According to the National Insurance Crime Bureau (NICB), staged accidents set the stage for subsequent acts of fraud ranging from faked or exaggerated injuries to unnecessary or excessive medical treatment.
Take for example the case of Mikhail Zemlyansky, a Long Island man who is now serving 15 years in prison for masterminding the nation’s largest no-fault auto insurance scam. Prosecutors alleged that Zemlyansky and more than 30 others cheated auto insurers out of hundreds of millions of dollars and conned more than 300 victims, including the elderly, out of $17 million.
“The Zemlyansky case is a stellar example of how teamwork among the feds, NYPD, the National Insurance Crime Bureau and major insurers put one of the nation’s most-prolific automobile crime rings out of business,” says James Quiggle, director of communications at the Coalition Against Insurance Fraud.
Quiggle also emphasizes the importance of consumer awareness in helping to fight fraud rings.
MORE: What to Expect in Traffic School
“Alertness by consumers to see the warning signs of a staged crash in progress or at the scene of a crash can play a big role in combating large, organized rings that are elbowing into insurance fraud,” Quiggle says.
Fortunately, staged accidents are not difficult to spot and prevent. Even at the crash scene, there are telltale signs that can help investigators determine if it is an attempt at fraud.
Common types of staged car crashes:
Swoop and squat
You are driving along in traffic and without warning, a car pulls in front of you and intentionally hits the brakes causing a rear-end collision.
Drive down
You are attempting to merge into freeway traffic when a driver waves your car forward. You merge over and the driver deliberately crashes into your car, making it look like you are to blame for the accident.
Sideswipe
You are making a left turn from an intersection with dual left-turn lanes. You drift slightly into the other lane so the driver sideswipes you.
T-Bone
You come to a complete stop at an intersection and then cautiously proceed through when a driver slams into your vehicle and claims that you ran the stop sign.
Wave-in
You are driving in heavy traffic and want to switch lanes. A driver waves you in and then slams into the back of your car claiming that he or she never waved you in.
Start and stop
You are driving along in heavy traffic. The driver in front of you starts to accelerate and as you begin, the driver slams the brakes causing a rear-end collision.
Warning signs that you were involved in a staged accident:

- The damage to the vehicle is minimal but the driver and passengers all complain of back and neck pain.
- The driver of the other vehicle or a complete stranger who shows up shortly after the accident provides a referral to a repair shop, doctor and/or lawyer.
- A tow truck immediately pulls over and offers to tow you.
According to the Coalition Against Insurance Fraud, you can protect yourself against falling prey to accident scams by following a few tips:
- Never tailgate.
- Apply your brakes if you see traffic slowing ahead of you.
- Count the number of passengers in the car(s) you collided with and get their names, phone numbers and driver’s licenses.
- Take cell-phone pictures of the other car, the damage it received — and the passengers.
- Call the police to the scene. Get a police report with the officer’s name, even for minor damage.
- Get involved if you are a witness. Watch for the warning signs of a scam.
By Aaron Crowe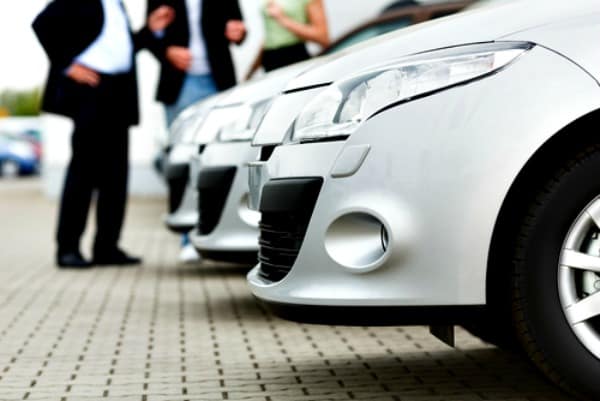
Online research is a smart way to evaluate a new car before buying, but it can’t replace getting the feel for a car with a test drive, auto experts say.More than one in 10 new car buyers skip the test drive, figuring the car is meant to get them from point A to point B and that a test drive isn’t needed, according to a recent study by Maritz Research.
The study found that 11.4 percent of car buyers didn’t test drive their car before buying it, though 52 percent found the test drive to be very influential in their decision to buy.
Drivers may assume that if they’re buying the same brand and model of car that they previously had, it isn’t worth test driving, says Chris Travell, vice president of strategic consulting for Maritz Research.
“This is unwise since the average American has been out of the car market for 6.5 years,” Travell says. “There have been huge advances in technology, vehicle design, ride and handling.
“The car the customer bought six or seven years ago is very different from the car they can buy” now.
For drivers who do test drive a new car before buying it, there’s much more to it than seeing how fast it accelerates when getting on the freeway, experts say. If shoppers really want to get a feel for a car before buying it, here are some things to check for in a test drive:
City driving vs. highway driving
Mileage varies by how the car is driven, and so does a driver’s experience in the car. See how it handles on city streets and on the highway. Does it have enough power on a freeway onramp to safely enter traffic? Is it comfortable at slow speeds?
Test the brakes and turning at different speeds.

 Car comfort and ergonomics
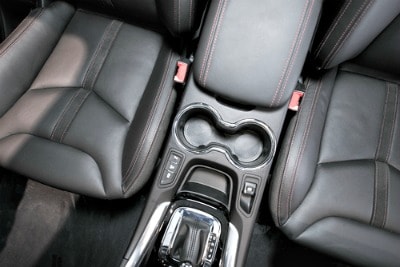
Can you get in and out easily? It’s a basic question that all buyers should answer, says Cathy Nesbit of Harry Robinson, a Buick and GMC dealer in Fort Smith, Ark. The driver should be able to reach everything comfortably, be able to easily adjust their seat, and have a comfortable seat, Nesbit says.
Do you need three rows of climate control or is one up front enough? And don’t forget cup holders.
Ergonomics can also be a hindrance to driving if there are too many gadgets and things in the car to keep your eyes on, says Chuck Hawks, a professional driver coach. “How distracting is the interior of the car?”
Basics of automobiles
Along with good acceleration, check that the brakes feel good, it turns well, and you can see everything around you. Check for blind spots. How is the wind and road noise?
Check out the trunk and back seats
Open the trunk and make sure there’s enough room for what you plan to use it for, recommends Mike Rabkin, president of From Car to Finish. If the rear seats fold down, test them, and check how easy it is to open and close the trunk and all of the doors.
CHECK OUT: How to Know You’re Getting the Cheapest Car Insurance
If you have kids or other passengers, check that the back seats are roomy enough for them. Rabkin suggests putting the tallest rider in the back seat and putting the front seat all the way back to test for leg room.
Dashboard and under-the-hood technology
Have the salesperson show you how all of the technology works in the car. This can include hands-free, voice activation, Bluetooth, USB ports, navigation, back up cameras, lane departure signaling and other extras, Nesbit says. Also ask if the extras are included in the cost of the car and how much extra it will cost for you to buy them.
 Driver’s view
Checking for blind spots isn’t the only view to check. Move the driver’s seat and mirrors as much as possible to ensure you have a comfortable seating position, within easy reach of all relevant controls, and a safe line of sight through all windows and mirrors, Rabkin recommends.
Interior quietness
Turn the radio off and listen to how loud the interior is, both on local roads and highway speeds, Rabkin says. You might hear the wind, squeaks or loose trim, for example.
Take a long drive, or a long sit
Part of being comfortable in a car, as mentioned above, is how well the seat feels and ergonomics. But most test drives don’t allow enough time to see how a four-hour trip will feel and if the driver will still feel refreshed after a long drive, says Hawks, who recommends sitting in a car on the showroom floor for as long as you can.
“Instead of waiting in an office, just go sit in the carseat,” he says.
Also take a one-hour or longer test drive, provided the dealer’s OK with it and knows ahead of time how long you’ll be gone, Hawks says. If a dealer knows you’re serious about buying, an overnight swap of your car for theirs may be allowed, and will give you a better, longer test drive, he says.
ALSO: Alzheimer’s, Driving and How to Talk to Your Aging Parents
Getting a test drive shouldn’t be difficult — arranging one over the Internet or by phone will help ensure a salesperson is available for one — and it’s a step a car dealer should want a potential customer to take before buying.
The Maritz study found that nearly four out of 10 customers don’t take their most considered vehicle out for a test drive, leaving four people who might have bought the car if they had taken a test drive.
This story has been updated since its original June 11, 2013 publication.

You probably remember that moment as a teenager when you finally got your driver’s license. It’s the one time in your life that driving is truly thrilling. You climbed behind the wheel, that little plastic ID card in hand, ready to take on the world as a full-fledged driver. Or so you thought. At first, driving was fun but also a bit terrifying. You had to remember to turn on the blinker, what all the signs meant, and how to change lanes on a busy freeway without panicking.
Within just a few years, driving loses its luster. Mostly, it becomes just a function of your day. This may lead you to believe that you’ve mastered the motor vehicle, but is that really accurate? Are drivers really as good as they think they are behind the wheel?
We surveyed 2,022 people to find out just how perception and reality stacked up. Turns out, people really do believe they’re good drivers. But does the reality match their perception? Read on to find out.
Perception vs. Reality

Driving culture can vary by state. Some states are known for their big cities with awful commutes and road rage. Others are characterized by slow, laid-back drivers. But we wondered how each state ranked for safest drivers.
What were the top 20 states with the most self-reported “good” drivers, and how did they rank in terms of crash fatalities? We were interested in how states’ perceptions matched up with safety outcomes. It turns out that New Mexico, Maine, and Oregon have the most self-reported “good” drivers and rank 47th, 22nd, and 19th, in terms of crash fatalities. What do you think of the states with the best and worst drivers?
Thoughts on Driving Ability

Some say that generational differences impact driving ability. Perhaps it’s simply that older generations have been driving longer. Or maybe older generations have spent their lives driving with fewer distractions and with a different generational perspective on how to be safe. Either way, it’s interesting to compare how attitudes differ among generations.
We analyzed responses from Millennials, Generation X, and the Baby Boomers. Most respondents thought they were good drivers; however, it’s interesting to note that as their ages increased, so did their beliefs that they were excellent drivers. Regarding safety, all respondents felt that they were safe drivers, but Baby Boomers overwhelmingly proclaimed (by over 50%) that they were very safe drivers.
When Driving Becomes Dangerous

Have you ever been involved in an accident? The National Highway Traffic Safety Administration (NHTSA) reports that over 2 million people were injured in car accidents in 2014. With the shocking number of people who are seriously injured or die every year, car accidents are no small matter. Though safety features and better road designs help lessen those rates, the key to not getting hurt while driving is to focus on the road.
Our respondents were asked to report on their history of car accidents, which we then compared among the generations. Millennials had the lowest accident rate overall, but this generation also hasn’t been driving as long as the others. Interestingly, Generation X drivers have been in more accidents than Baby Boomers. Does that mean Baby Boomers are the safest drivers overall? We’ll leave that up to you to decide.
It’s All About the Skills

When it comes to some aspects of driving, it’s less about getting from point A to point B and more about your overall driving skills. Certain things are just trickier for some drivers than others, such as parallel parking. Additionally, things have changed in car-making trends throughout the last few decades, which leads to a decline in certain skills. Automakers are responding to these trends: for example, making fewer cars with manual transmissions.
We asked our survey participants to talk about their driving skills. The majority of Millennials said they couldn’t drive a stick shift (nearly 63%), while Baby Boomers were the biggest group (about 71%) to say they could drive a manual car. When it came to parallel parking, proficiency increased with age: About 56% of Millennials said they were very or moderately comfortable with this parking maneuver, while nearly 64% of Generation X and almost 73% of Baby Boomers reported the same confidence.
Testing Driving Knowledge

After finishing driver’s ed class, we all have to take the dreaded driving test. After finally passing, we move on to more important things, like actual driving. If you were to take a driving test today, would you be able to answer all the questions correctly?
We were curious to see if our participants could correctly respond to some of the common questions on written driving exams. Most chose the right answers. However, when it comes to who should go first at four-way stops, Millennials seemed the most confused.
Men vs. Women: Self-Perceptions

Ah, the age-old question of whether a man or a woman can do one thing better than the other. When it comes to driving, everyone has an opinion about the opposite sex. But what do they think of themselves?
The data from our respondents to two similar, yet differently worded, questions are intriguing. About 38% of men proclaimed they were excellent drivers, while only a little more than 25% of women felt the same way about themselves. However, when asked if they were safe drivers, men and women answered at similar rates across the board.
Gender and Accidents

Everyone seems to want to weigh in on gender and driving behaviors – from researchers to everyday people. Men are more likely to engage in high-risk driving behaviors, and road rage is an issue for them. Marketing researcher Brandon Gaille looked at road rage statistics and discovered that men are more likely to get angry while driving, which often leads to accidents.
We wondered how both genders would respond to our survey question about their accident rates. Interestingly enough, both reported an almost 50/50 split; over 54% of women had been the driver involved in an accident, and about 52% of men stated they had.
Gender and Driving Incidents

When it comes to gender and car accidents, statistics tell us that men get into far more accidents than women, especially when they are young. Men are more likely to engage in risky driving behaviors, like not wearing their seat belts and speeding. However, the greatest fatality rates for both genders occur during their first few and last few years of driving.
We searched through the Fatality Analysis Reporting System (FARS) database to find out just how much risk men take on when driving. With an overall car accident death rate of 10.59 per 100,000 people, men are 3.5 times more likely to die in car accidents than women. When it comes to speeding, drunk driving, and not wearing a seat belt or helmet, men are 4.3 to 5.2 times more likely to die from accidents involving these behaviors.
Gendered Driving Skills

Driving skills are an important part of being a good and safe driver. But how do those skills stack up when you look at them by gender? Stereotypes tell us that men are better at specific driving skills. But are they really?
We separated the responses to questions about parallel parking and manual transmission abilities by gender and looked at the results. Both genders seemed to think that they were moderately comfortable with parallel parking, with only a slight edge for men (35%) over women (31%). But far more men said that they felt very comfortable with their parallel parking skills at 33%, versus women’s response rate of less than 19%. When it comes to the ability to drive a manual transmission, over 61% of women said that they didn’t know how to drive a stick shift, whereas nearly 51% of men said that they could.
Men and Women Take the Driver’s Test

With the high-risk behaviors that men tend to engage in, at least while they are young, does this influence their results when taking a mock driver’s test? Granted, these questions are tricky; many of us tend to scratch our heads wondering if we actually know the right answer. Curious how men versus women would perform? So were we.
The responses to the questions may or may not surprise you. It turns out that men and women gave just about the same rates of right and wrong answers, with some pretty negligible differences. It looks like our driving patterns might be a bit different, but we have the same kinds of knowledge overall. Good or bad, we are all in it together.
Conclusion
For some, driving can symbolize the freedom of a fun weekend road trip. For others, it brings back traumatic memories of accidents and scary driving experiences. Most of us experience a mix of both. As research shows, our perceptions of our driving don’t always align with how we actually drive. With the advent of smartphones and their ability to distract drivers, we are at even more risk than ever before. Additionally, we know many of the driving rules that keep us safe, but some lack knowledge when it comes to who gets to go first at a stop sign.
Gender seems to be a serious issue regarding risk-taking. Young men tend to drive dangerously, which leads to serious injuries and death. When it comes to overall skills, however, it seems that men and women are about even.
Methodology
We surveyed 2,022 people on their driving skills and tested them with some basic driving questions. For our additional information on safety outcomes, we analyzed the FARS database for crash fatalities and specific driving behaviors like speeding, alcohol consumption, and seat belt usage.
Sources
https://www.washingtonpost.com/local/trafficandcommuting/little-old-lady-behind-the-wheel-not-the-baby-boomers/2015/06/17/8fa601b8-04b1-11e5-a428-c984eb077d4e_story.html
http://www.iihs.org/iihs/topics/t/distracted-driving/topicoverview
http://www-nrd.nhtsa.dot.gov/Pubs/812246.pdf
http://www.roadandtrack.com/car-culture/a6308/whats-really-killing-the-manual-transmisson/
http://www.iihs.org/iihs/topics/t/general-statistics/fatalityfacts/gender
http://www.ncbi.nlm.nih.gov/pmc/articles/PMC4117653/
https://healthfinder.gov/FindServices/SearchContext.aspx?topic=14522
https://www.researchgate.net/publication/288041152_Sex_and_Age_Differences_in_the_Endorsement_of_Sex_Stereotypes_Associated_with_Driving
http://journals.plos.org/plosone/article?id=10.1371/journal.pone.0150227
http://www.iihs.org/iihs/sr/statusreport/article/50/1/1
https://www.buzzfeed.com/justinabarca/can-you-actually-pass-a-driving-test?utm_term=.hq78aw2EX#.ce65zjn9x
http://brandongaille.com/21-startling-road-rage-facts-and-statistics/

Obnoxious. Pushy. Combative. Whatever you call these drivers, you’ve surely encountered them on the road at some point or another. But what actions cross the line from simply rude to flat-out aggressive? Is one state’s aggressive driving simply another state’s norm? And how do opinions vary among different age groups, genders, and drivers of certain vehicles?
To get a handle on how Americans feel about aggressive drivers, we surveyed 2,000 drivers on the subject. They shared their feelings about everything from horn honking to hand gestures – and some of the results just might surprise you. Keep reading for the uncensored truth about anger and courtesy on the road.
What Is Aggressive Driving?

Just what does aggressive driving entail? We presented survey respondents with an array of behind-the-wheel behaviors and asked them to rank them on a scale of 0 (harmless) to 3 (aggressive), with inconsiderate and bad driving falling in the middle. The acts deemed most aggressive came with threats of physical harm: ramming a vehicle, trying to run a car off the road, wielding a weapon, and making sudden moves.
Running a red light, preventing a fellow driver from passing or merging, and making a rude hand gesture fell in the middle. Playing loud music was ranked least threatening of all, followed by driving slowly down the left lane, honking, and scowling at other drivers.
Bad Drivers in the Busiest States

No interstate rivalries come into play here: We asked drivers in the four most populous states to rank the skill levels of their own state’s drivers – and the results are in! Who’s the worst? Florida drivers get the lowest ratings, followed by Texas and California. On the other hand, New Yorkers take the cake when it comes to skillful driving.
Courteous Drivers in the Busiest States

When it comes to exhibiting kindness on the road, it turns out Southern gentility rules: Among the four most populous states, drivers from the Lone Star State awarded fellow Texans the highest scores for their courteous driving. However, New York drivers – honk! “Get out of the way, bud!” – were deemed the rudest. California and Florida fall in the middle of the polite-driver pack.
Vehicle Types and Aggressive Driving Opinions
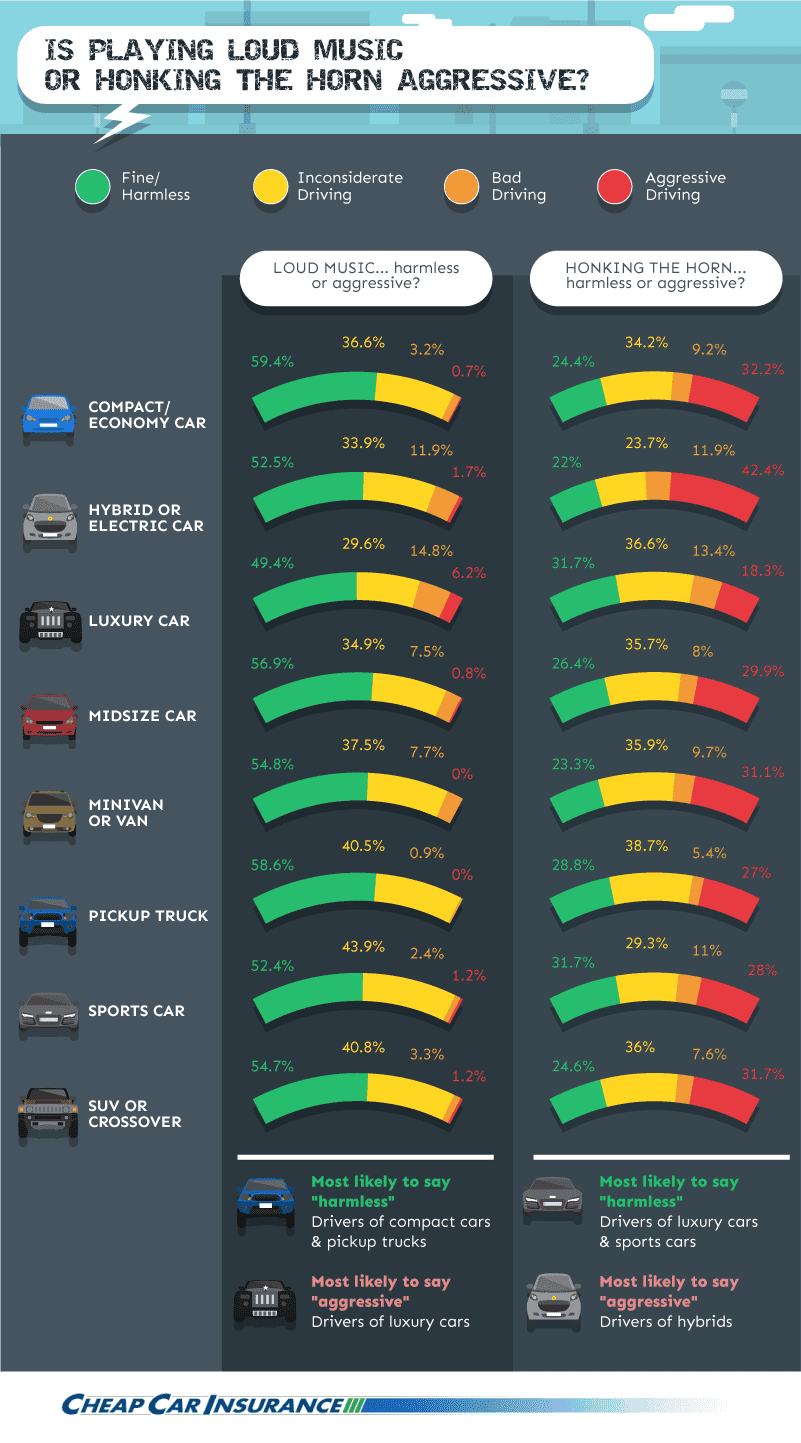
Does the type of car someone drives affect his or her outlook on fellow drivers’ behavior? Drivers of pickup trucks and compact cars are the most likely to consider it harmless when fellow motorists blast music; luxury car drivers, on the other hand, are by far the aptest to find it aggressive. What about horn honking? Drivers of luxury vehicles and sports cars are likeliest to deem honking the horn harmless, while hybrid car drivers are the most likely to think it is aggressive.

People driving hybrids and sports cars are the most likely to rate flipping the bird or other rude hand gestures aggressive, while drivers of minivans were the most apt to find them harmless. As for tailgating, hybrid and sports car drivers are the likeliest to find the risky act harmless, while drivers of pickup trucks think following too closely is an aggressive act.
Rudeness While Driving in Private and Public

Everyone feels annoyed behind the wheel sometimes. But there’s a big difference between swearing under your breath and cursing loudly at another driver. Over 21 percent of our respondents admit they swear at other drivers daily – but only under their breath. Another 26.5 percent do so weekly, and over 21 percent hurl quiet profanities around once a month. Just over 12 percent say they’ve never been uncivil on the road.
On the other hand, only 1.6 percent swear loudly or make offensive hand gestures to other drivers every day. Just over 5 percent are publicly rude around once a week, while just under 9 percent lash out around once a month. However, nearly 54 percent say they’ve never cursed or flipped the bird at a fellow driver.
Car Color and Behind-the-Wheel Aggression

As marketers know, color is powerful: It can affect a person’s mood and even raise or lower blood pressure. But does the color of a person’s car affect how colorful their behavior is behind the wheel?
An assessment of personality based on car color by a color consultant and trend forecaster asserted that drivers of black cars are “powerful” and “elegant” – but our survey revealed that they are the most likely to honk their horn or chew out other drivers. “Outgoing” and “dynamic,” red car owners ranked second for likeliness to get angry, followed by otherwise “calm” or “confident” drivers of blue cars.
Interestingly, our survey revealed that drivers of yellow cars (who tend to be “joyful,” according to the color expert) are by far the least likely to behave angrily toward other drivers.
Aggressive Driving Across Generations

People from each generation have unique traits and outlooks – including their views on aggressive driving. Baby Boomers (ages 52 to 70) are by far most likely to deem loud music aggressive and inconsiderate, while older millennials (ages 25 to 34) are aptest to find it harmless.
Interestingly, younger millennials (ages 18 to 24) are the most likely to view honking as aggressive, while Generation Xers (ages 35-51) are least likely to consider it aggressive.
When it comes to rude hand gestures, again younger millennials are the most likely to feel that flipping the bird is an act of aggression. Baby Boomers are much less likely than every other generation to think it’s harmless, but they do not feel quite as threatened by the gesture.
Courtesy and Rudeness on the Road

Finally, we asked respondents to open up about the behavior they see on the road every day. The verdict? Just under one-fifth of people encounter offensive drivers (who refuse to let them change lanes or merge) virtually every day. Another 36.5 percent run into the issue at least once a week.
As for courteous drivers who slow to let people change lanes or merge? Just over 16 percent experience this daily, while nearly 47 percent encounter kindness on the road once a week. It’s clear in this situation at least, that courtesy rules.
Dealing With Aggressive Drivers
As our survey reveals, definitions of harmless and aggressive driving can vary widely. Among factors that might color our opinions? Location, age, gender – and perhaps even the type and color of our own cars!
You can model courteous behavior on the road, but you can’t change other drivers’ behavior – however, you’re in charge of how you respond. If you encounter a driver who is behaving aggressively, try to avoid them at all costs. Don’t respond to gestures or even look at them. If the situation escalates, call 9-1-1 to provide a vehicle description and travel location.
Your behavior (and responses to bad behavior) can go a long way toward making the road a safer place for everyone.
Methodology
We surveyed 2,089 drivers in the U.S. between May 12 and May 15, 2016. Respondents were between the ages of 18 and 75 and came from all 50 states, plus the District of Columbia. They were 47.5% female and 52.5% male.
Sources
http://www.huffingtonpost.com/2011/11/27/how-color-affects-our-moo_n_1114790.html
http://www.today.com/home/blue-red-or-silver-find-out-what-your-car-color-t81381
https://www.dot.nd.gov/divisions/safety/streetskills/aggressivedrivers.htm
Fair Use
If you’re interested in using the images from this project, please feel free to do so. We simply ask that you attribute CheapCarInsurance.net for the content, and provide a link back to this page, so your readers can learn more about our work.
By Aaron Crowe
 Can’t get your car’s Bluetooth system to sync with your phone? Does the car’s navigation system misinterpret your commands and not get you where you need to go? You’re not alone.
A recent study by J.D. Power and Associates found that 20 percent of all customer-reported problems on vehicle reliability were for problems with infotainment, navigation and in-vehicle communication systems. Tech is the most problematic area on most vehicles and is causing the industry’s 3 percent year-over-year decline in vehicle dependability, according to the 2016 U.S. Vehicle Dependability Study.
Complaints about technology were the top concern in this year’s study, up from the third most last year and fifth in 2014.
Getting technology to work correctly can be frustrating, as anyone who has set up a Wi-Fi system at home knows. But not having it work in your car — where entertainment, navigation and other systems can cost thousands of dollars extra from the dealer — can be especially frustrating.
And the car tech problems don’t go way with time. The study found that customers reported tech woes within the first 90 days of ownership, and that the problems were still bothering them three years later.
Bluetooth pairing and connectivity, along with built-in voice recognition systems misinterpreting commands, were the most reported problems. Navigation systems that are difficult to use or inaccurate are among the 10 most frequently reported problems.
“Most consumers these days expect a car to have Bluetooth,” which is standard in most vehicles, says Barb Tate, national fleet manager at a GM dealer in Toronto.
The voice navigation systems and touch displays in GM vehicles work well if a driver is trained well in how to use it, Tate says. The display looks like an iPad, she says, and customers best learn how to use it if a salesperson lets them push the buttons instead of the salesperson pushing them. Different accents and intonations can affect how voice-activated systems work, Tate says.
“A lot of people don’t have the patience to let the technology do what it can do,” Tate says.
Integrated Bluetooth for phone calls and music streaming was a key feature that Nenad Cuk, 27, wanted when he paid about $2,500 more for a 2013 Hyundai Sonata Limited with extra tech features. Cuk, a marketing manager in Salt Lake City, Utah, said he got the streaming and pairing to work, but giving voice instructions to it doesn’t work so well.
“The one thing I am not happy about though is the hands-free talking function, because I have been told that I sound muffled or far away,” he says. “This makes sense as the microphone is fixed, but apparently it is fixed on a location that makes it hard for even me to reach. So sometimes I find myself taking the call into my hands, while driving, just so the other person can hear me better.”
Cuk also doesn’t use the car’s GPS often, and instead uses a map app on his phone. That may be the easiest go-around for drivers.
Paul Ritterbush, 29, of Berkeley, California, says the Bluetooth on his 2013 Ford Edge works great and links with his phone so calls come over the car’s speakers. Ritterbush found that a map app on his phone is more accurate and easier to use than the navigation system in his car.
These tech problems, which consumers may think should be simple to solve, don’t instill confidence in more complex technology such as autonomous cars that drive themselves.
“Right now, if consumers can’t rely on their vehicle to connect to their smartphone, or have faith that their navigation system will route them to their destination, they’re certainly not yet ready to trust that autonomous technology will keep their vehicle out of the ditch,” Renee Stephens, vice president of U.S. automotive at J.D. Power, said in a statement.
![]()
![]()
You’re driving home from work one evening and suddenly you see it: a police car hiding behind an overgrown tree. Panicked, you look down at your speedometer and realize you were driving well over the speed limit. Will you get away scot-free or be chased down by flashing lights?
If the latter occurs, you’re not alone. In the U.S., around 41 million people receive speeding tickets each year, which translates into around 112,000 per day. To find out more about speed trap trends across the nation, we analyzed 15 years’ worth of data from The National Speed Trap Exchange – a site run by the National Motorist Association that allows users to post information about speed traps and allows other users to vote on the credibility of the reports.
Do some states and cities have more speed traps than others? Where do motorists most frequently report seeing police cars hide? We also created an interactive feature so you can discover the most common cities for speed traps in your state. Read on to get the details.
Interactive: Cities Near You With the Most Speed Traps
Select your state from the drop-down menu to see which cities in your area are prone to numerous speed traps.
States With the Most and Fewest Speed Traps
![]()
![]()
A glance at the map reveals that some states rely on speed traps more than others. Several states in the Midwest and West fall on the low end, numerous states scattered across the country have slightly more, and one state accelerates to the top of the list: Vermont. With 52 speed traps per 100,000 residents, the Green Mountain State has over five times more than last-place Alaska.
In an effort to reduce speed-related fatalities, Vermont has been involved in state-specific and regional crackdown initiatives. One stretch of I-89 in Vermont is particularly notorious for speed traps: An officer parked under a canopy of trees has stopped numerous drivers for excessive speeding, defined as traveling 95 mph or more. New Hampshire, Michigan, Delaware, and Oklahoma all make the top 10 list for speed trap prevalence.
On the other hand, Alaska averages fewer than 10 speed traps per 100,000 people. A recent study revealed that the police force in Anchorage – the state’s biggest city – is understaffed. Speed traps in North Dakota, South Dakota, and Montana are also scarcer than average. Strikingly, these three states also rank in the top 10 in the nation for rate of car crash fatalities. Nationwide, speed ranks as a factor in just over a quarter of traffic deaths.
Worst Cities for Speed Traps
![]()
![]()
Even if your state isn’t crawling with speed traps, you may live near a city that’s notorious for them. Cities located in Florida, Michigan, Texas, Colorado, Pennsylvania, and Ohio all made the top 10. Sarasota, FL, had the most speed traps of all, with an average of 140 traps per 100,000 residents. Dearborn Heights, MI, took second place, and Coppell, TX, came in third. Even the No. 20 city St. Clair Shores, MI, had a surprising 78 speed traps per 100,000 residents. If you plan to visit to any of these cities, keep an eye on your speedometer – or better yet, set your cruise control.
Common Police Hiding Spots Reported by Motorists
![]()
![]()
When you think about speed traps, what do you envision? We analyzed keywords within speed trap data reported by motorists to determine the likelihood of speed trap locations. The most common phrase? “Side of the road” had 133 more mentions than the next-most-common term. Based on this analysis, other common locations for speed traps include at the bottom of a hill, at the top of a hill, in a parking lot, in a median, and on the side of the street.
Most Common Words and Terms Related to Speed Traps
![]()
![]()
We also analyzed phrases that motorists used when reporting speed trap information and created a word cloud to demonstrate their frequency. The larger the word is, the more prominently it was used. As you can see, drivers chat about location of speed traps (“parking lot”), reasons behind certain locations (“limit drops”), and even specific types of law enforcement (from “motorcycle cops” to “county sheriff”).
Top Intersections and Roads for Speed Traps
![]()
![]()
Speed traps aren’t located everywhere within a city – instead, they are strategically located in certain spots. We analyzed user-reported data (focusing on information deemed credible by other users) to uncover the spots where motorists have reported seeing speed traps the most. The chart above reveals the top spots in the U.S where you may be likely to encounter a speed trap.
Conclusion
You may live in an area where speed traps are common – or perhaps these stakeouts are not even on your radar. Either way, odds are you will drive by one at some point. As our report reveals, many states and cities across the nation are home to either drastically more or fewer than average.
There’s no doubt speed traps are controversial – although law enforcement maintain that the goal of speed traps is to increase safety, opponents assert that they are simply one more way for states and municipalities to generate funds. Some motorists even believe that police officers must meet ticket quotas or that they keep a cut of speeding tickets they issue (both are false). Websites and apps have sprung up to alert drivers to watch for them.
The truth? According to the National Highway Transportation Administration, 3 in 10 drivers are speeders. And in 2014, over half of speeding-related fatalities occurred on roads with speed limits under 55 mph. Your best bet to thwart speed traps is common sense: Don’t speed. Motorists’ top reasons for putting the pedal to the metal are that they’re late, they have an emergency or illness, or they weren’t paying attention. However, one fact rings true: No reason is important enough to risk your life or the lives of others on the road.
Methodology
We analyzed 15 years of driver-reported National Speed Trap Exchange data and determined viable speed traps by including only those speed traps that had more “yes” votes than “no” in order to ensure that we were not including any speed traps that were deemed “not a speed trap” by the NSTE community. For the “Most Driver-Confirmed Speed Traps Per State,” we pulled the speed trap locations with the most “yes” votes from our data that we were able to effectively geotag that had at least 25 “yes” votes and fewer than five “no” votes.
Sources
http://www.statisticbrain.com/driving-citation-statistics/
http://www.courant.com/news/connecticut/hc-windsor-highway-safety-0505-20150504-story.html
http://digital.vpr.net/post/one-stretch-i-89-excessive-speed-hotspot#stream/0
http://www.adn.com/article/20160317/anchorage-still-needs-dozens-new-officers-ideal-police-force-study-says
http://www.iihs.org/iihs/topics/t/general-statistics/fatalityfacts/overview-of-fatality-facts
http://business.time.com/2013/09/02/end-of-the-road-for-speed-traps/
http://www.cnn.com/2015/02/08/opinion/navarrette-waze-speed-traps/
http://www.wcax.com/story/18951854/drivers-caught-in-vermonts-new-speed-trap
http://www.nhtsa.gov/nhtsa/Safety1nNum3ers/august2015/S1N_Aug15_Speeding_2.html
Fair Use
Feel free to reuse any of the assets found in this project. When doing so, we ask that you please link back to Cheap Car Insurance and this page to give your readers a chance to explore our full report and the data behind it.

In 2014, 32,675 people died in motor vehicle crashes in the U.S. – and it appears that rate is only increasing. Every time you get behind the wheel, you have the potential to affect the lives of everyone else on the road. That’s why it’s vital to be the best driver possible. We’ve all heard the clichés about the skill levels of certain drivers, whether based on gender, race, or age. But in terms of these potentially offensive stereotypes, how much of the hype is even true?
To separate fact from fiction when it comes to accident-prone drivers, we gathered information from the National Highway Traffic Safety Administration’s Fatality Analysis Reporting System (FARS). How do the driving behaviors of people of different genders, races, and ages compare in terms of involvement in deadly accidents? And which states are home to the riskiest drivers? Keep reading to get the facts.
Risky Driving Behavior by Gender
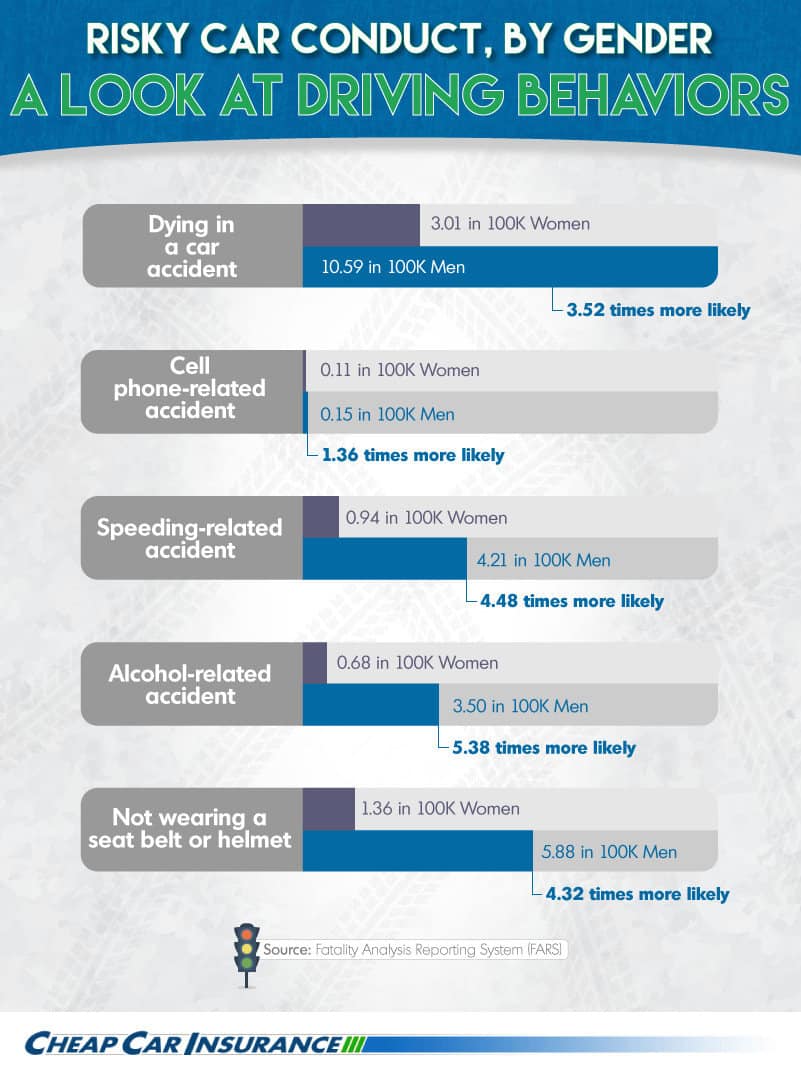
Have you ever heard someone crack a joke about women drivers? The above graphic reveals some telling facts that contradict this often-heard critique: Men are more than five times likelier to get in an alcohol-related accident, almost 4.5 times more apt to get in a speeding-related accident, and nearly 1.4 times likelier to get in a cellphone-related accident. Men are also more than 4.3 times likelier to forgo safety measures (seat belts in a car and helmets on a motorcycle). The result of this risky behavior? Men are more than 3.5 times likelier than women to die in a motor vehicle accident.
Risky Male Drivers by State
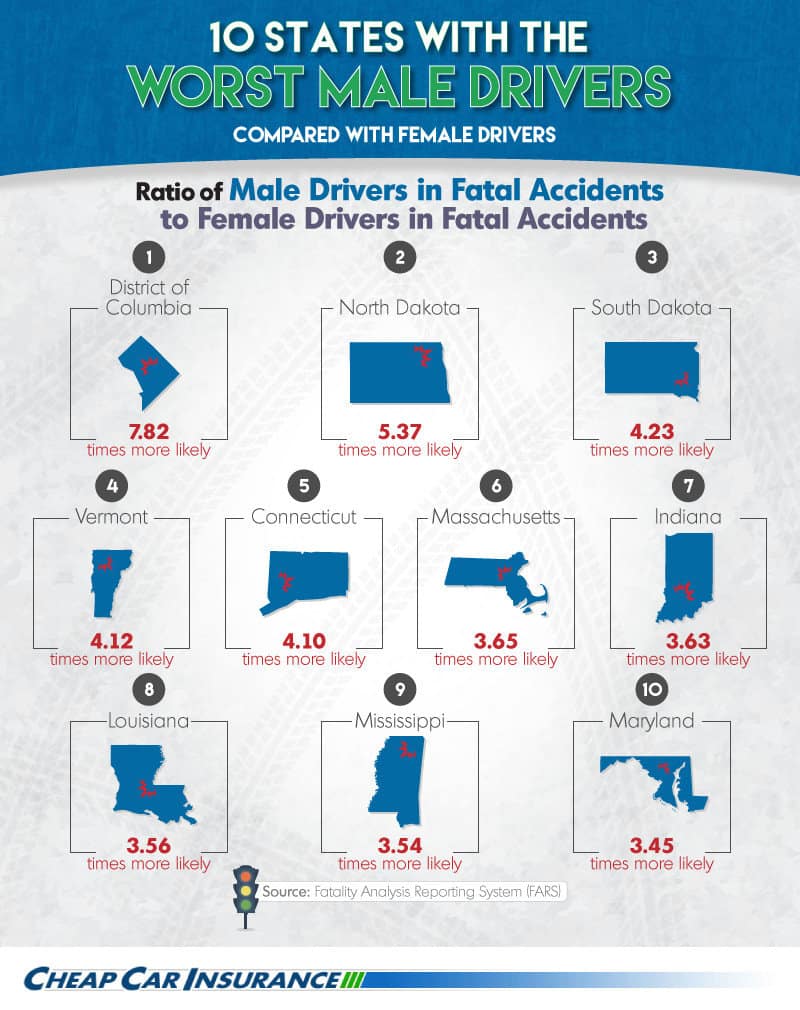
Overall, men are more likely than women to be involved in fatal accidents – and in some states, the difference is staggering. In Washington, D.C., male drivers are nearly eight times more apt to get in a fatal crash than female drivers. Additionally, men are over five times likelier to get in a deadly accident in second-place North Dakota and over four times likelier in South Dakota, Vermont, and Connecticut.
Accident-Prone States by Gender

Fatal accidents can occur across the country, but the states in the graphic above see more than their fair share. Wyoming tops the charts for deadly accidents involving men and women: More than 46 per every 100,000 male residents are involved in fatal crashes, and over 19 per every 100,000 female residents are. Why? Its low population contributes to a high “per 100,000” rate, long distances can make it difficult for accident victims to receive timely medical attention, and officials report that many Wyoming drivers don’t use seat belts.
South Dakota takes second place for crashes involving women as well as fifth place for accidents involving men. North Dakota, Mississippi, and Oklahoma also make the top 5 for men, while Alabama, Montana, and Tennessee round out the top 5 for women.
Mapping Fatal Accidents by Gender
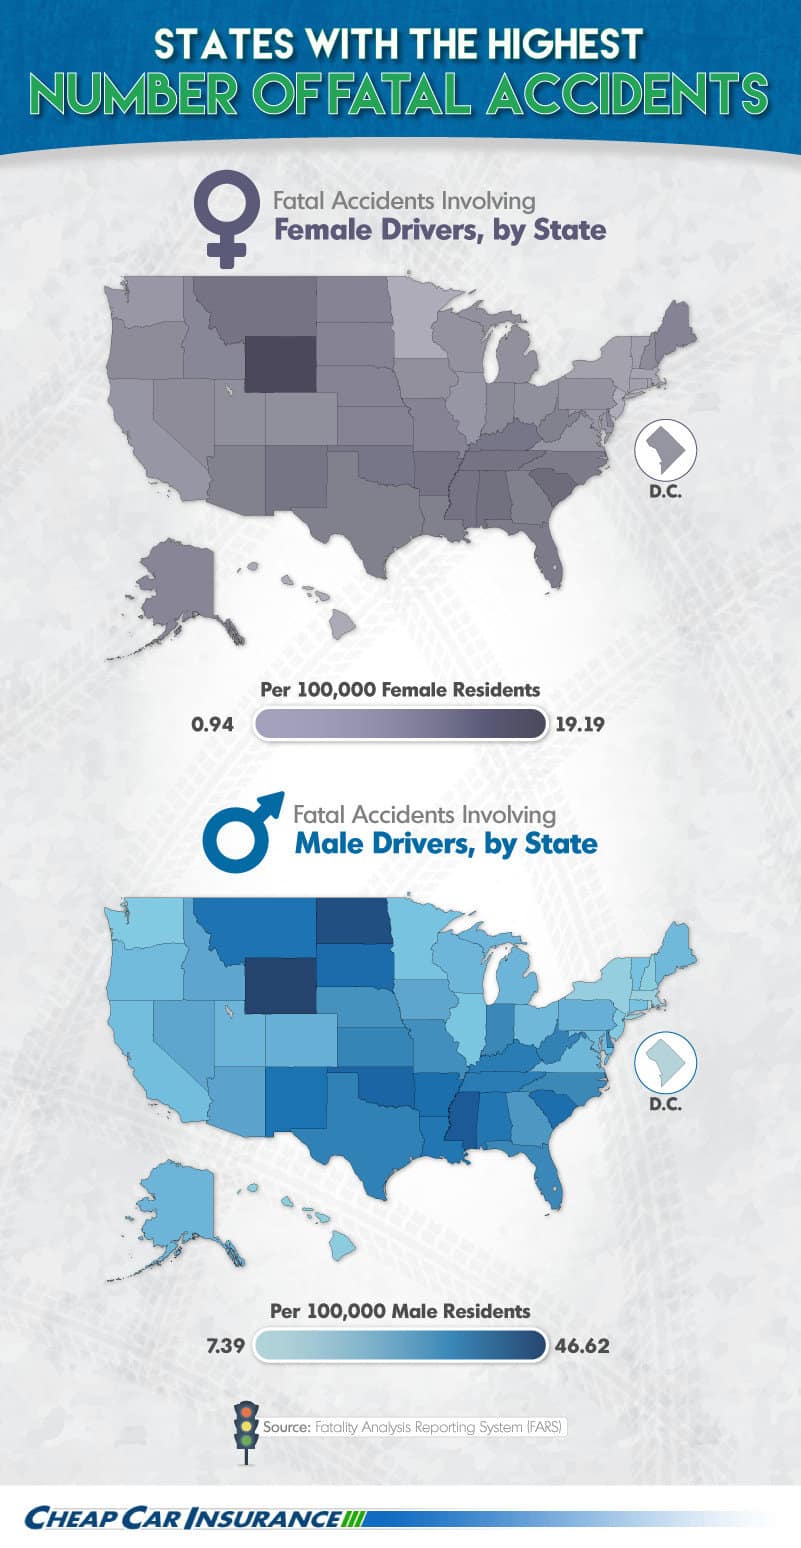
Comparing the maps of the highest number of fatal accidents involving either men or women paints an interesting picture. Overall, men are involved in many more deadly accidents than women. Some states show similarities – Wyoming is the top state for both genders, although men get in over twice as many fatal crashes. However, in North Dakota, the second-place state for male drivers, men average nearly 44 fatal accidents per 100,000 male residents, while women average only eight per 100,000 female residents. South Carolina takes second place for women, with almost 13 deadly crashes on average. On the other end of the spectrum, men in Washington, D.C., average just over seven deadly accidents, while women are involved in fewer than one.
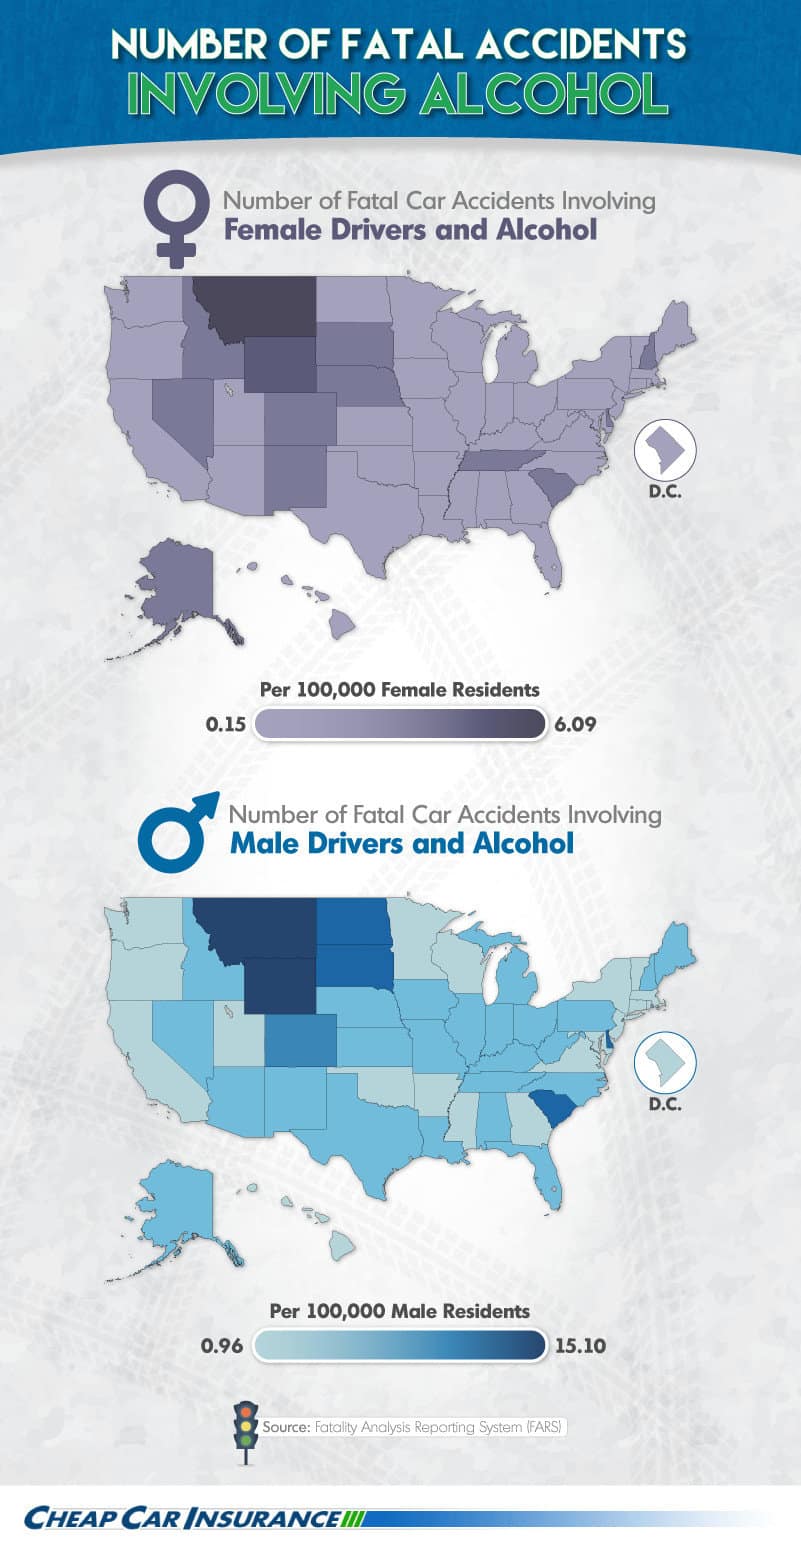
Mapping Alcohol-Related Fatal Accidents
The map above focuses on fatal accidents that involve alcohol consumption. For both genders, Montana is the top state for these types of crashes: Men average over 15, while women get in just over six. Wyoming comes in second, with just over four accidents for women and nearly 12.5 for men. As for states with the fewest alcohol-related deadly crashes, New York saw fewer than one for men and Minnesota saw fewer than 0.2 involving women.
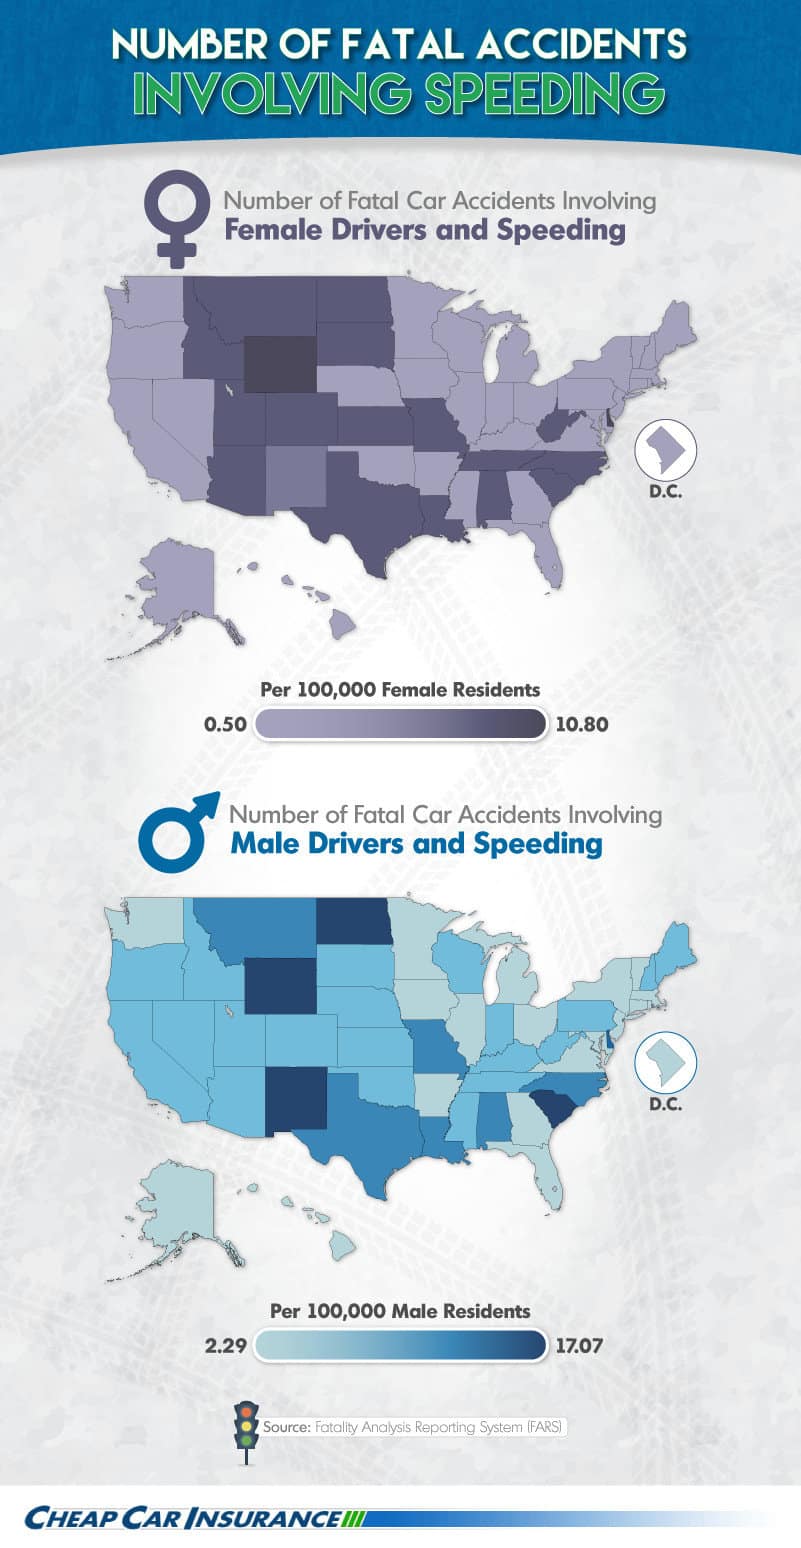
Mapping Speeding-Related Fatal Accidents
The above map zooms in on deadly accidents that involve speeding. Delaware is the No. 1 state for speeding-related fatal accidents that involved women, with almost 11 per 100,000 residents. Wyoming takes second place, with almost 10. When it comes to men and speeding, North Dakota claims the top spot with 17 accidents, followed by Wyoming (16) and New Mexico (almost 14.5). On the other hand, Massachusetts saw the fewest accidents for women, while Virginia had the fewest involving men.
Women’s Fatal Accidents by Race
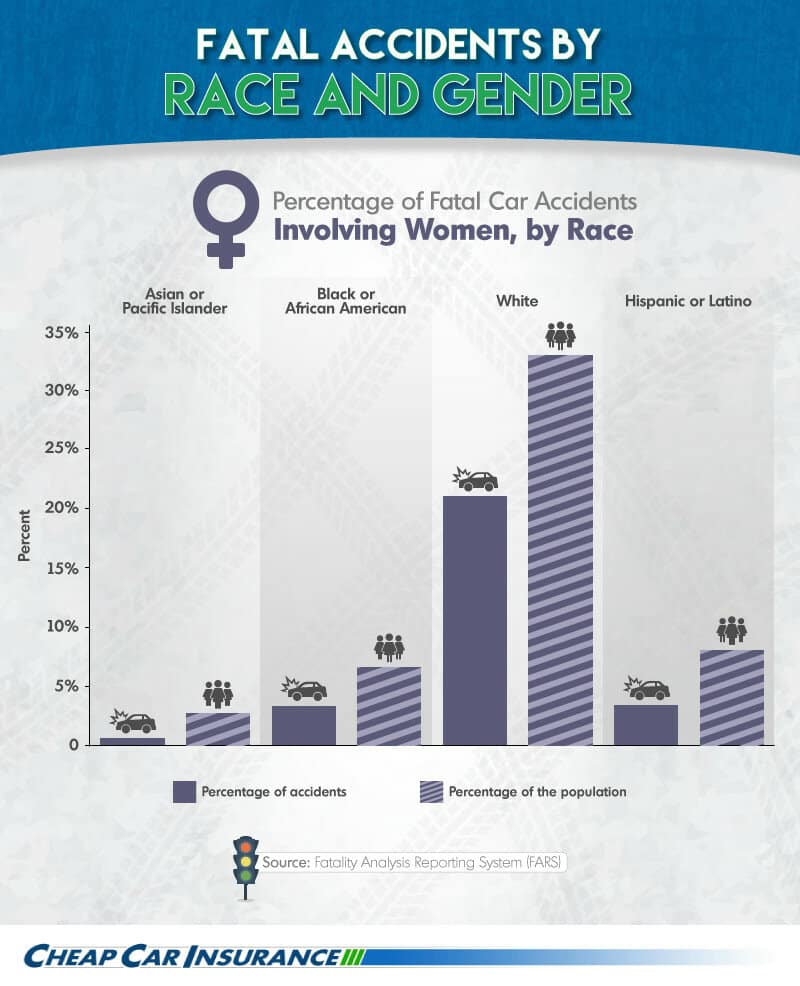
The graphic above provides a racial breakdown of women who are involved in deadly accidents. It appears that the stereotypes about certain minority drivers do not ring true. Asian/Pacific Islander women are involved in the lowest percentage of deadly accidents in proportion to their representative population. Proportionally, white women are involved in the highest percentage of fatal crashes, followed by black/African American women and then Hispanic/Latino women.
Men’s Fatal Accidents by Race
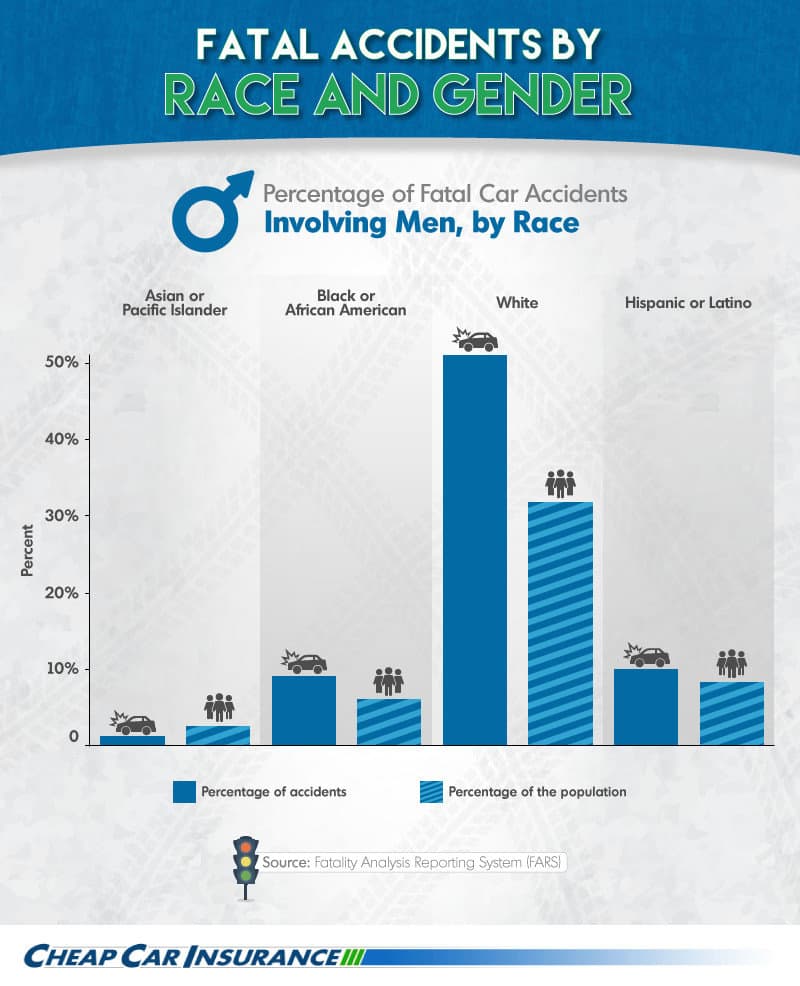
Breaking down the races of men involved in fatal accidents (based on each group’s population proportion) reveals a similar snapshot to the involvement of women: White men are involved in a much higher percentage of fatal crashes than any other group. Black/African American men come in second, followed closely by Hispanic/Latino men. Again, Asian/Pacific Islander drivers show the lowest involvement.
Driving Behaviors by Race
Conclusion
Driving is serious business – and it turns out that stereotypes about certain drivers are unfounded and certainly nothing to joke about. Our research offers a surprising glimpse of drivers’ involvements in fatal accidents broken down by gender and race.
Across the country, men are involved in more fatal crashes than women. Male drivers not only typically drive more miles, but they also tend to engage in risky behavior more frequently. Unfortunately taking certain risks can spell the difference between life and death – so it’s vital to obey road rules, utilize safety features such as seat belts and helmets, and never drive while distracted or under the influence of alcohol.
Methodology
The Fatality Analysis Reporting System (FARS) classifies a deadly crash as one in which a vehicle’s motion causes a fatality. We downloaded FARS 2014 raw data rather than using the querying tool, as it contains a wider set of criteria for driving behaviors such as speeding, the presence or use of alcohol, and cellphone use. The data pulled in this analysis will vary from the data pulled using similar variables in the querying tool due to the differences in criteria mentioned above. We collected information for fatal car accidents that occurred in 2014 and conducted the analysis in STATA using the “person,” “vehicle,” and “violation” files. We recoded “sex” in STATA so that our new variable only included “male” and “female”; it ignored records for “not reported” and “unknown.” For information on drivers, we looked at only “seat_position 11,” or the driver’s seat. The variables used for driving behaviors were: “mviolatn” (violations charged), “mdrdstrd” (driver distracted by), and “rest_use” (restraint system/helmet use). They were recoded as follows:
Drinking = 1 (yes, drinking was involved) if mviolatn = 11, 12, 13, 14, 15, 16, 19
Speeding = 1 (yes, speeding was involved) if mviolatn = 21, 22, 23, 24, 25, 26, 27
Cellphone = 1 (yes, cellphone use was involved) if mdrdstrd = 05, 06, 15
Seatbelt = 1 (no, no seatbelt or helmet was worn) if rest_use = 07
Variables concerning race were recoded as follows:
White = 1 if race = 01
Black = 1 if race = 02
Asian = 1 if race = 04, 05, 07, 18, 28, 48, 68
Hisp_rec = 1 if Hispanic = 01, 02, 03, 04, 05, 06
More information on the variables used can be found in the FARS User Guide 2014.
For our per capita calculations, we used Census 2010 data and for the “more likely to” calculations, we divided the male per capita calculations by the female per capita calculations, excluding instances that did not report the gender of the driver.
Sources
- http://www.nhtsa.gov/About+NHTSA/Press+Releases/2015/2014-traffic-deaths-drop-but-2015-trending-higher
- http://www-nrd.nhtsa.dot.gov/Pubs/812240.pdf
- http://www.wyomingnews.com/news/fatal-crashes-increase-in/article_385859e9-9f49-5b0f-9d86-72f0dea20310.html
- http://www.iihs.org/iihs/topics/t/general-statistics/fatalityfacts/gender
- ftp://ftp.nhtsa.dot.gov/fars/2014/DBF/
- ftp://ftp.nhtsa.dot.gov/fars/FARS-DOC/USERGUIDE-2014.pdf
Fair Use
Feel free to share the images found on this page freely. When doing so, please attribute the authors by providing a link back to this page, so your readers can learn more about this project and the related research.
By Craig Guillot
 Americans with low credit scores are falling behind on car loans at a rapid pace.
Fitch Ratings reported in March the number of subprime auto borrowers whose payments were more than 60 days late reached 5.16 percent — the highest rate in 20 years.
As more people are defaulting, the average car loan is increasing, too. According to Experian Automotive, the average new-car loan in the U.S. reached an all-time high of $29,551 at the end of 2015, and the average monthly payment was near $500.
If you’re falling behind or struggling to make your car payments, acting fast can help you save money, avoid hassle and maybe let you keep your car, too.
Contact your lender
Automotive expert Lauren Fix, also known as The Car Coach, says calling your lender is the first thing to do because “no financial institution wants you to default.” Repossession is often the least profitable option for a lender, she says. The lender has to cover the cost to repossess the car and then sell it at auction for less than market value.
“They would rather have you call than to not pay and totally ignore them,” says Fix.
Lenders have their own guidelines and regulations, but consumers may avoid repossession “if they’re acting in good faith,” says Steven Raj, vice president of Park State Bank in Duluth, Minnesota. “There are options. Full communication between the borrower and the lender is the first step.”
Options your lender can offer
One common option for people behind on car payments is a loan extension, Raj says. The lender can waive a few payments and then add them onto the back of the loan. The loan will still accrue interest, but a few months without payments can allow the borrower to catch up during a temporary financial strain. Lenders can also move the payment due date or offer refinancing.
Refinance
David Weliver, millennial financial expert and founder of MoneyUnder30.com, says you could refinance if you have good credit and haven’t fallen too far behind on payments. “Refinancing could make sense if the car is only a few years old, your existing loan has a high interest rate and your credit has improved since you bought the car,” says Weliver.
Landing a lower interest rate and extending the terms can significantly reduce your monthly payments.
Example: You’re in the third year of a five-year, $15,000 loan. Your interest rate is a steep 11 percent, and your payments are $326.14 per month. Refinancing that same balance for another five years at 3 percent (if you have good credit) would bring the payments down to $269.53 per month.
However, extending the loan means paying more interest over the long term. Fix says consumers should carefully read the terms of any refinance agreement. Do the math to see if you’d save money. But even if you’re not, refinancing could still benefit you by enabling you to make your payments.
Sell the vehicle
You could sell your car, use the proceeds to pay off the loan and buy a cheaper vehicle. Some lenders can also arrange for a new buyer to take over the payments on a loan, assuming the buyer qualifies.
“If you have a (car) that no longer works within your budget, then selling the vehicle for one that does is the best route,” says Raj.
Nick Clements, co-founder of MagnifyMoney.com, says it depends on how much equity the person has. Most dealers will allow a buyer to trade in a vehicle with an outstanding loan, but it can be tricky when they’re “upside down.” For example, if a consumer has a vehicle worth $15,000 but owes $18,000 on it, he’ll still have to pay off that $3,000 before trading in the car.
Turn in the keys
Also known as voluntary repossession, this option involves turning over the vehicle to the lender. It could be a solution if you have no equity or no feasible way to keep the car. In some states, however, Weliver says you still must pay the difference between what you owe and what the car sells for at an auction, plus fees.
This decision will heavily impact your credit score, and your credit report will still reflect any balance due. A voluntary repossession should be seen as a last resort.

Car accidents happen all the time. You probably think it won’t happen to you, and this is actually how a lot of people see road accidents. Many people think that if they’re careful, they wouldn’t experience being in an accident. But the thing about being on the road and being involved in a car crash is that it’s not entirely up to you. There are other motorists out there who drive recklessly.
To spread more information regarding the topic, we’ve collected the numbers from some of the most respected sources and made them into easy to understand infographs. We’ll walk you through the breakdown of the stats below.
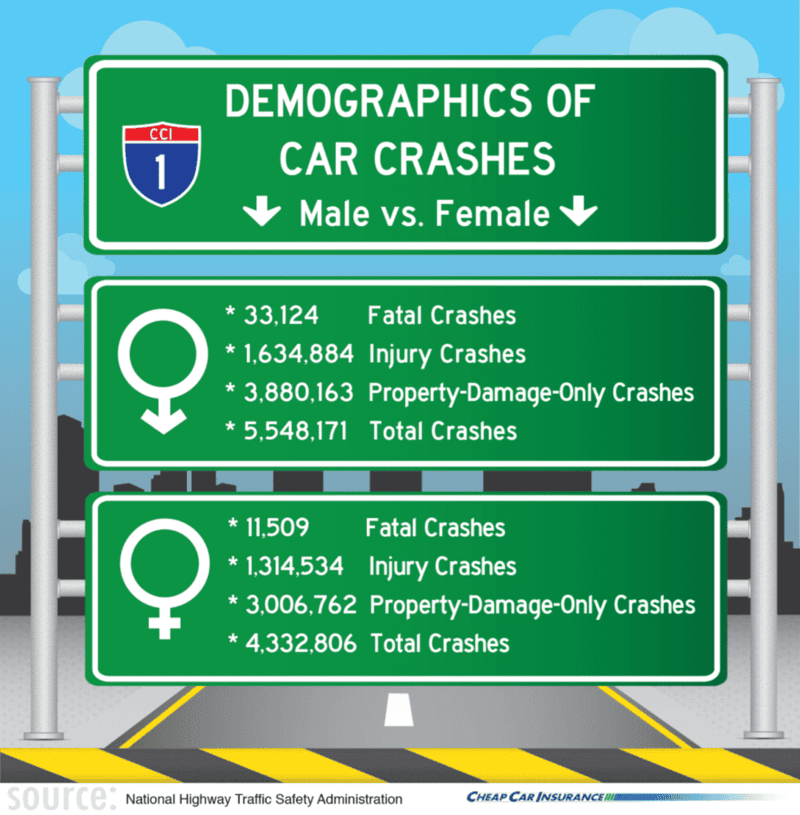
On the infograph above, we can clearly see that males are responsible for more car crashes than females. This does not mean that females are better than males at driving. It may simply be because there are more male drivers, or it may be because males are more likely to participate in risky behavior. Whatever the reason, the important thing to remember is that the numbers on this graph are real. Fatal car crash incidents reach thousands per year and car crashes that injure people and damage property reach millions per year. This means that getting involved in a car accident is not as rare as you think.
Crash Statistics
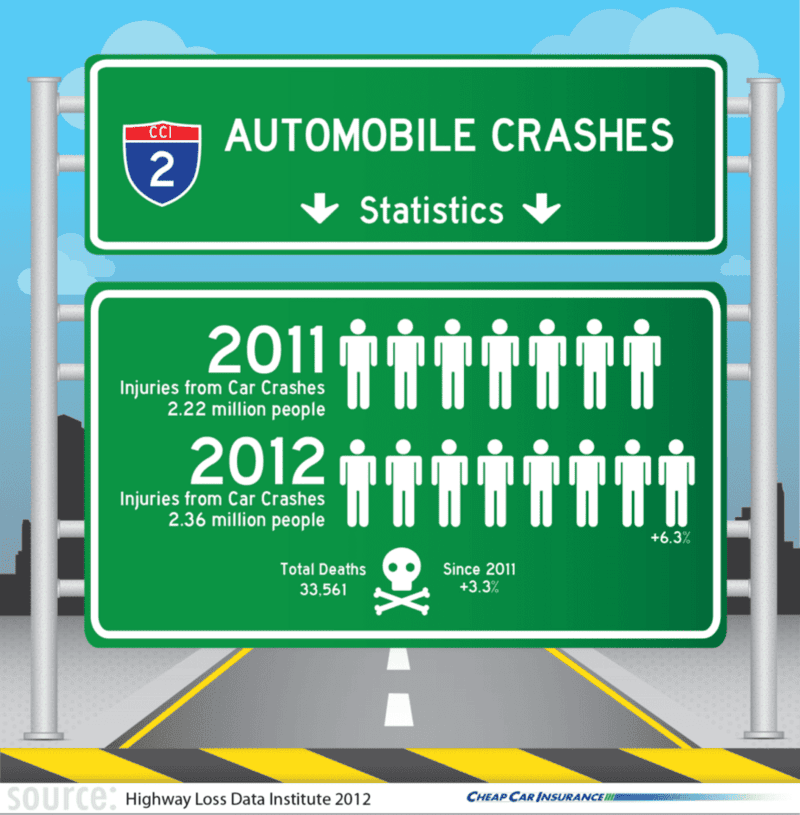
In the data collected from the National Highway Traffic Safety Administration, we can clearly see that the number of deaths and injuries involving vehicular accidents is on the rise. Cars aren’t the only ones responsible for these deaths, damages, and injuries, as motorcycles, bicyclists, and pedestrians also played a part.
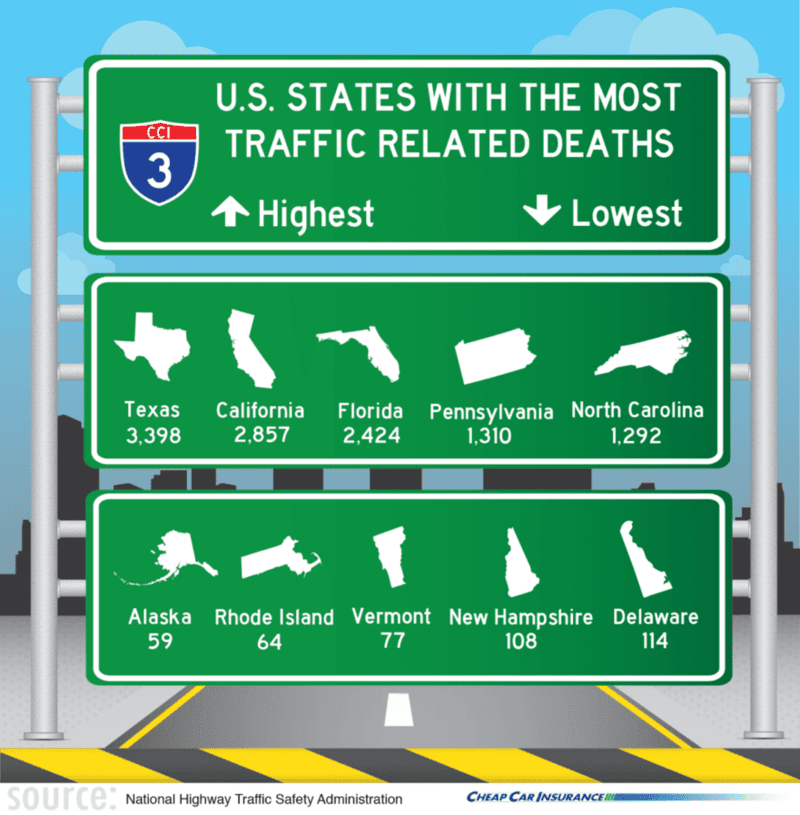
Check out the different states and how they rank when it comes to car accidents.
Laws for Your Driving Protection
Seat Belt Laws
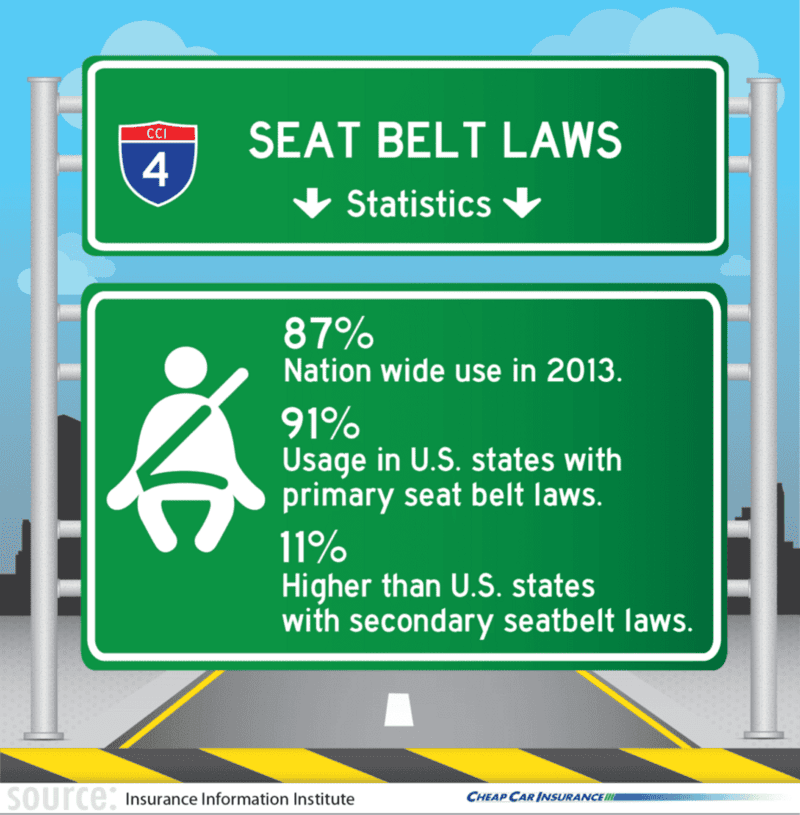
The District of Columbia along with 33 other states have primary seat belt enforcement laws. This means that a police officer can stop a car if the passengers inside the vehicle are not wearing seat belts. The other remaining states have secondary seat belt laws, which mean that the police can issue a seat belt violation only if the driver has broken another traffic rule. Currently, only New Hampshire is without an adult seat belt law. The record for the highest seat belt usage is 87%, which was reached in 2013. States that have implemented a primary seat belt law have an average rate of 91% usage, 11% higher than states who only have secondary seat belt laws.
Drunk Driving Laws
Drunk driving accounted for 10,322 deaths in the U.S. alone in 2012. It has risen by 4.6% from 2011. This upward trend has not always been the case because drunk driving fatalities had been steadily declining since 2003. The trend may be because of the many traffic laws passed since. In D.C., the definition of drunk driving was redefined, setting the limit for drunk driving to 0.08% blood alcohol concentration from the former 0.10%. Many states have also implemented a liquor liability law, which holds bars or businesses serving alcohol accountable for the damages that a drunk driver may cause.

Cellphone Laws
Fourteen states, including the District of Columbia, have already completely banned the use of mobile devices for all drivers while 37 states have restricted cellular phone use for new drivers. As for texting, D.C. plus 44 other states have already prohibited the practice while behind the wheel.

Older Drivers
14% of the population was older than 65 years of age back in 2012. This accounts for around roughly 43.1 million residents. Despite their small number, the drivers from this age group accounted for 17% of all car accidents in the same year. For this reason, additional laws have been passed restricting the licenses of older motorists. This could mean being allowed to drive but only during the day, or a restriction to drive on some major freeways. Needless to say, this depends on every driver’s ability. Some younger drivers may even get a restriction if they have a medical condition that could affect their ability to drive.

Young Driver Laws
Unsurprisingly, drivers who are young account for a large number of vehicular accidents. For this reason, some states have adopted laws in which young drivers aren’t allowed to drink even small amounts of alcohol. Almost all States including the District of Columbia have also implemented a Graduated Drivers License program for 15- to 18-year olds, where people who are learning how to drive go through a more rigorous and longer process before getting a driver’s license. According to the National Highway Traffic Safety Administration (NHTSA), this program involves 3 stages. Initially, the student driver obtains a learner’s permit and approval would depend on the results of a vision test, a road knowledge test, driving accompanied by a licensed adult, seatbelt use by everyone in the car, a zero BAC level, and six months without a crash or a conviction for traffic violations. The second stage includes a behind-the-wheel road test, advanced driver education, driving accompanied by an adult at night, and 12 consecutive months without a crash or traffic violation conviction. After this, they can apply for a full and unrestricted driver’s license. The only exception to this is New Hampshire, as they do not issue learner’s permits.
Different states require different durations before issuing a driver’s license to learner’s permit holders. In most cases, 6 months is the required duration. Colorado, Florida, Georgia, Iowa, Kansas, Mississippi, North Carolina, North Dakota and Vermont, however, require a 12-month learner’s permit provisional period. Virginia requires 9 months, while Wyoming only requires a provisional period of 10 days.
In addition, restrictions on night driving for teens have been implemented in all states except Vermont. Excluding Florida, Iowa, Mississippi, North Dakota, and South Dakota, all the other states have also created a regulation restricting the number of teen passengers allowed in a single vehicle when the driver is also a teenager. This is because according to the Children’s Hospital of Philadelphia and State Farm, teens have a greater risk of getting involved in a car crash if other teens are in the vehicle as well.

Driverless Cars
Nevada was the first state that approved driverless or self-driving cars on the road in May 2012. California, Florida, Michigan, and the District of Columbia have since passed similar laws and many other states are considering doing the same.
Aggressive Driving
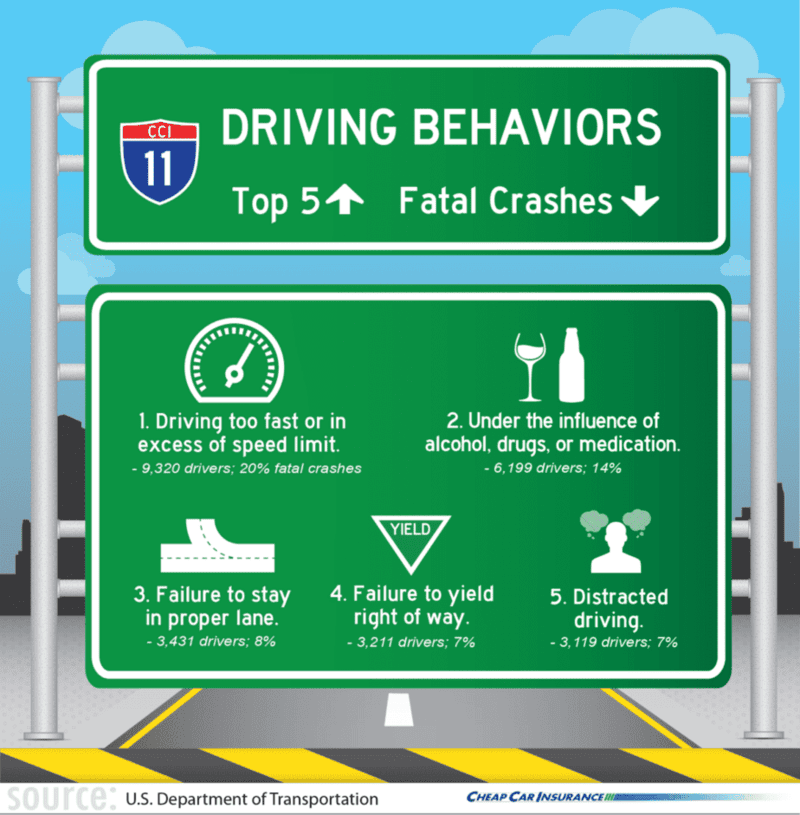
According to the National Highway Traffic Safety Administration (NHTSA), aggressive driving is a “major factor” in traffic accidents, “playing a role not just in well-publicized incidents of road rage, but in a large number of fatal highway collisions each year.” NHTSA defines aggressive driving as “an individual commits a combination of moving traffic offenses so as to endanger other persons or property.” Even though the definition of “aggressive driving” still remains fluid to this day, one of the main factors that constitute accidents that would fall on aggressive driving is speeding.

Distracted Driving
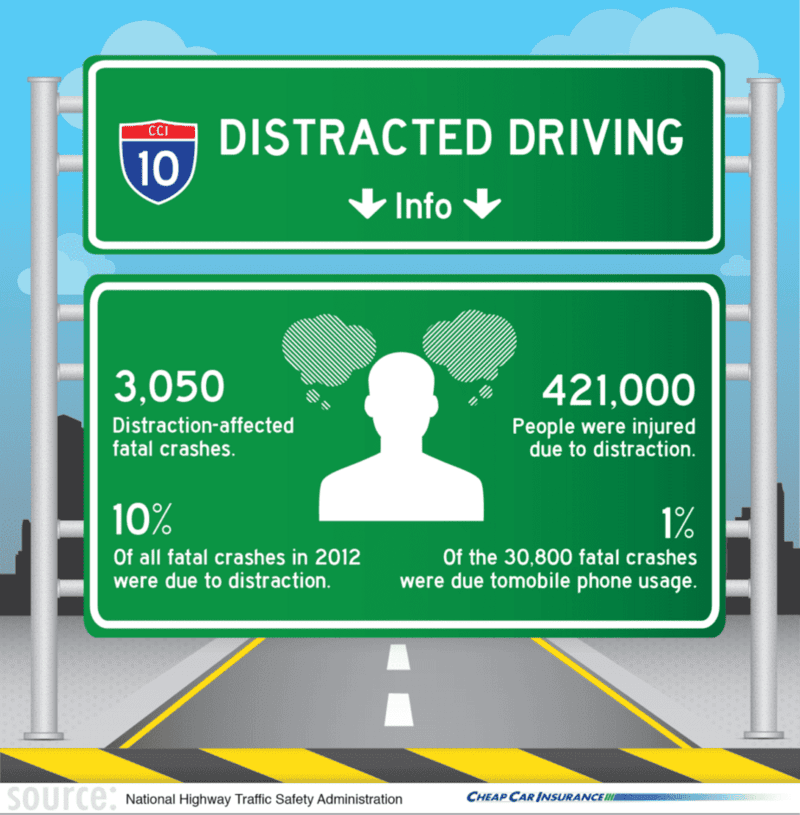
The definition of “distracted driving” according to NHTSA is “activities that take a driver’s attention off the road, including talking or texting on cellphones, eating, conversing with passengers and other distractions.” In 2010, NHTSA updated the way they evaluated distracted driving through a more specific measure called “distracted-affected crashes,” this focuses more on the actual distractions that are most likely to impact accident involvement like using mobile devices and being distracted by a passenger or other external events.
Driving Behaviors Reported For Fatal Crashes
Theft Statistics
No matter how many laws are passed to prevent accidents that would harm you and your vehicle, accidents happen. Worse, theft happens. In 2011, around 230 vehicles were stolen for every 100,000 according to the National Insurance Crime Bureau. This amounts to more than $4.3 billion in losses due to vehicle theft. The average price per vehicle theft was $6,089.
Top 10 Cities With The Highest Motor Vehicle Theft Rates

Top 10 States With The Most Motor Vehicle Thefts
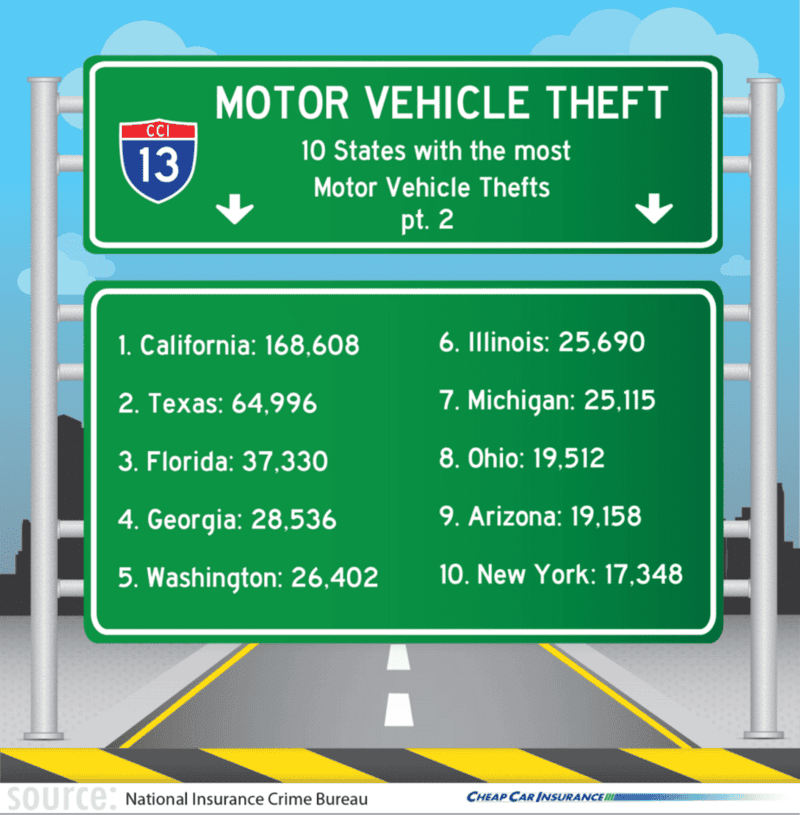
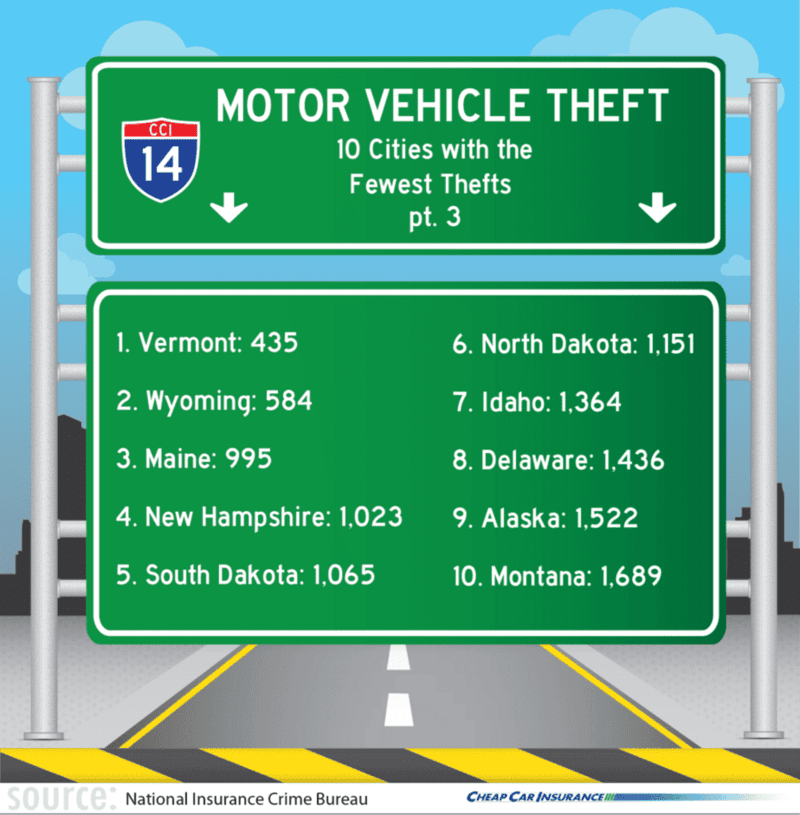
Top 10 Cities With The Fewest Motor Vehicle Thefts
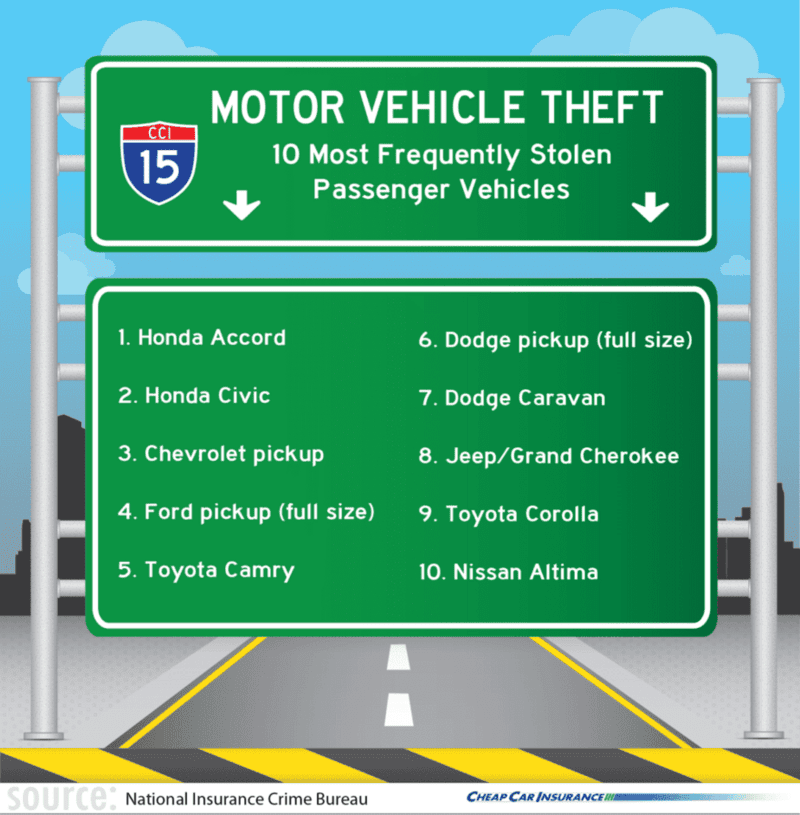
Top 10 Cities Most Frequently Stolen Passenger Vehicles
Uninsured Motorists
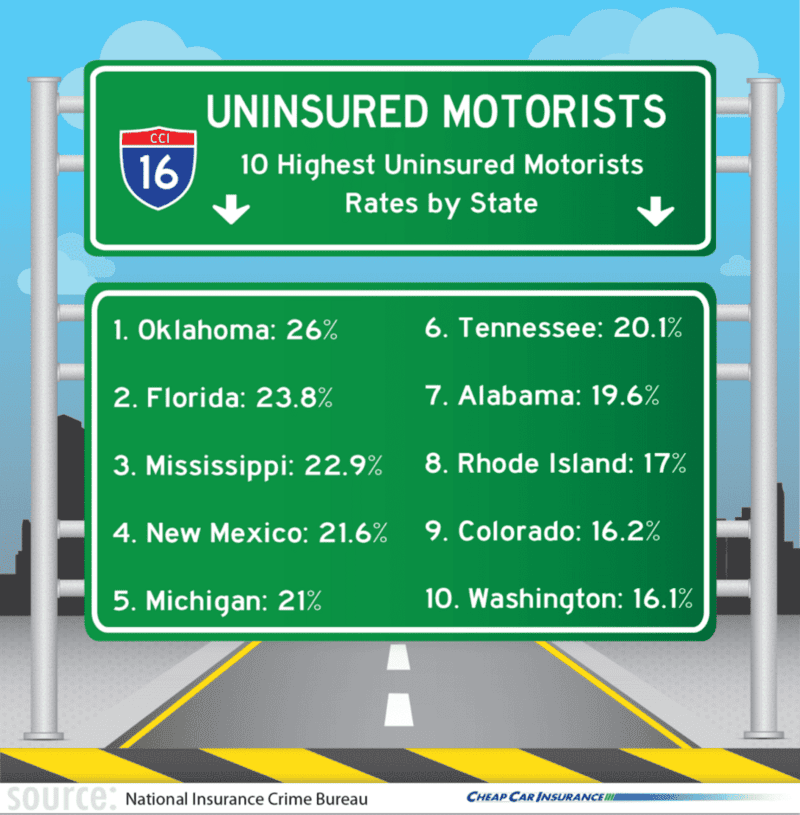
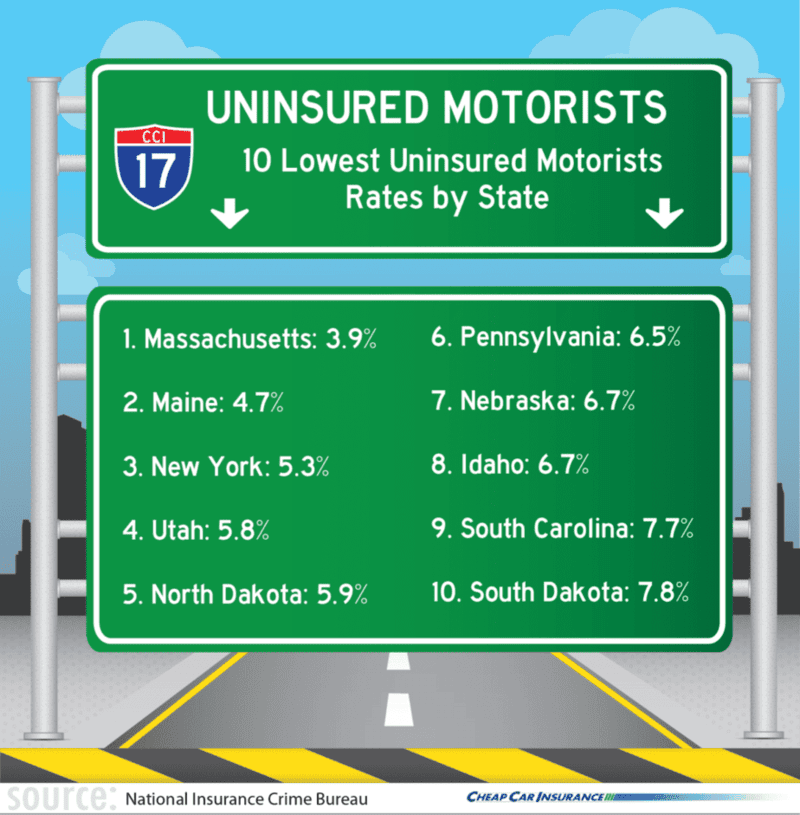
Despite these glaring numbers on car fatalities, not all motorists are insured. In 2012, about one in every eight or 12.6 percent of drivers were uninsured. Though this percentage has declined in recent years, some states still have an alarming number of motorists who are uninsured. Oklahoma had the highest rate of uninsured drivers at 26%. Massachusetts, on the other hand, had the lowest incidence of uninsured motorists at only 4%, according to a 2014 study by Insurance Research Council.
Forty-nine states along with the District of Columbia oblige motorists to have some form of auto liability insurance. New Hampshire is the only state that does not necessitate the purchase of insurance although they have a financial responsibility requirement. This mandate requires drivers to prove that they have the financial capability of paying for damages in case they meet an accident. According to the Insurance Information Institute, some states including Texas, Nevada, Oklahoma, Wyoming and California already have online auto insurance verification systems to detect uninsured drivers.
Top 10 Highest Uninsured Motorists By State
Top 10 Lowest Uninsured Motorists By State
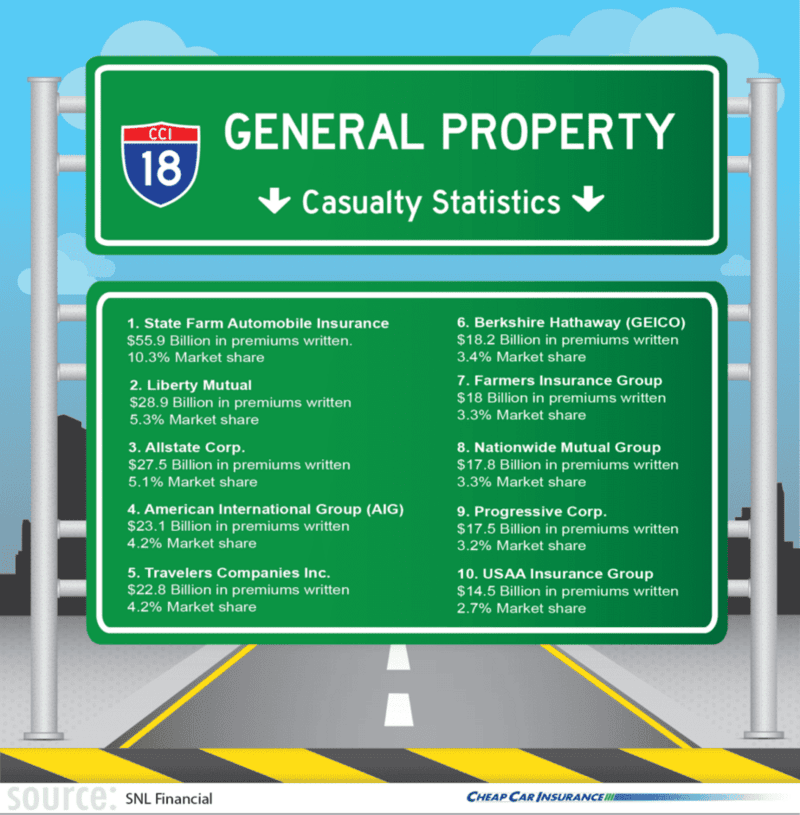
General Property/Casualty Statistics
In 2013, the U.S. insurance industry’s net premiums alone amounted to $1 trillion, with property/casualty insurers accounting for 46% of recorded premiums. This was calculated after deducting certain risks that are transferred to other insurers, according to SNL Financial. Out of the leading 10 global insurance companies in 2013, two were U.S. based, namely Berkshire Hathaway, which took the number one spot and United Health Group at number five. From 2004 to 2013 alone, the property and casualty net premiums written increased by 13%.
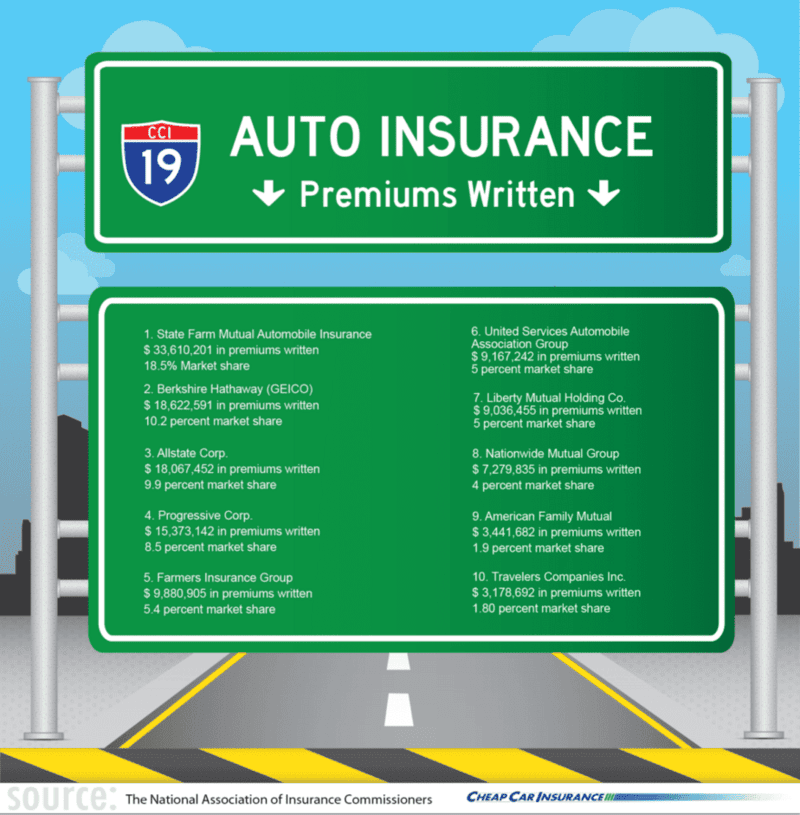
Auto Insurance Premiums Written
In 2011, the total private passenger auto insurance premiums written amounted to $163.3 million, while $168 million and $174.8 million worth of insurance premiums were written in 2012 and 2013 respectively.
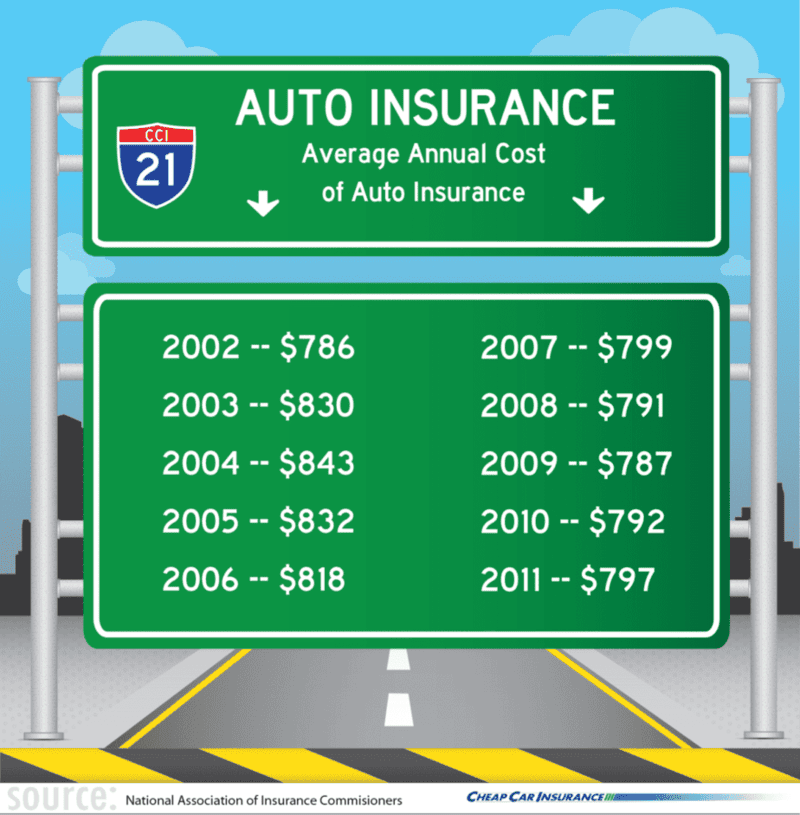
Auto Insurance Costs and Expenses
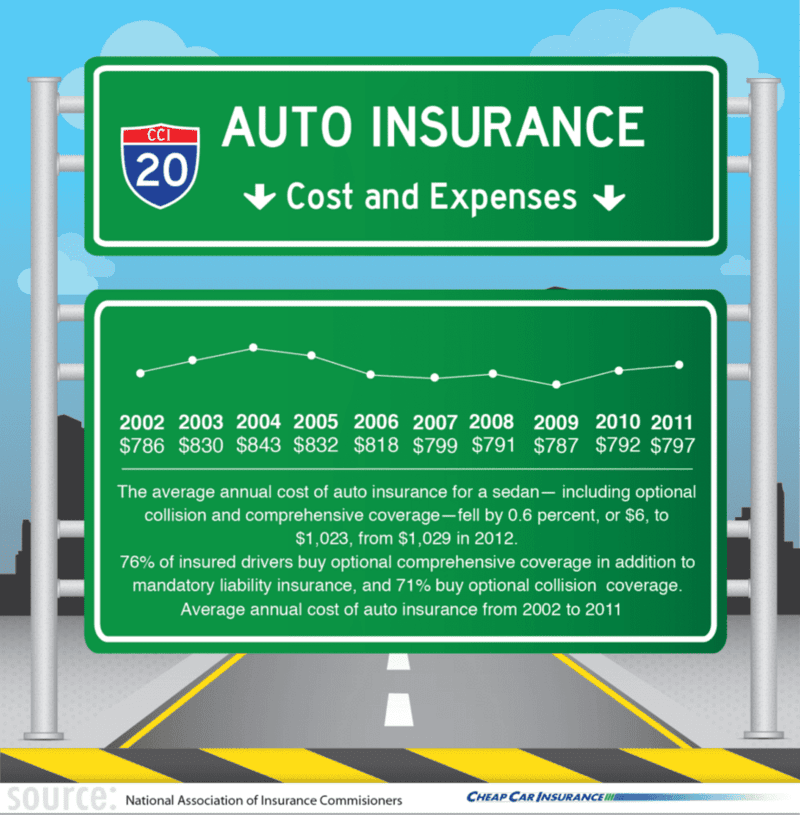
A study by AAA’s 2014 Young Driving Costs revealed that the average cost to own, operate, and maintain a sedan was $8,876 in 2013. This has decreased by 2.7% (roughly $246) from the year before. According to the results of the study, “The cost reflects a relatively large decrease in fuel costs and lower tire, depreciation, and insurance costs.”
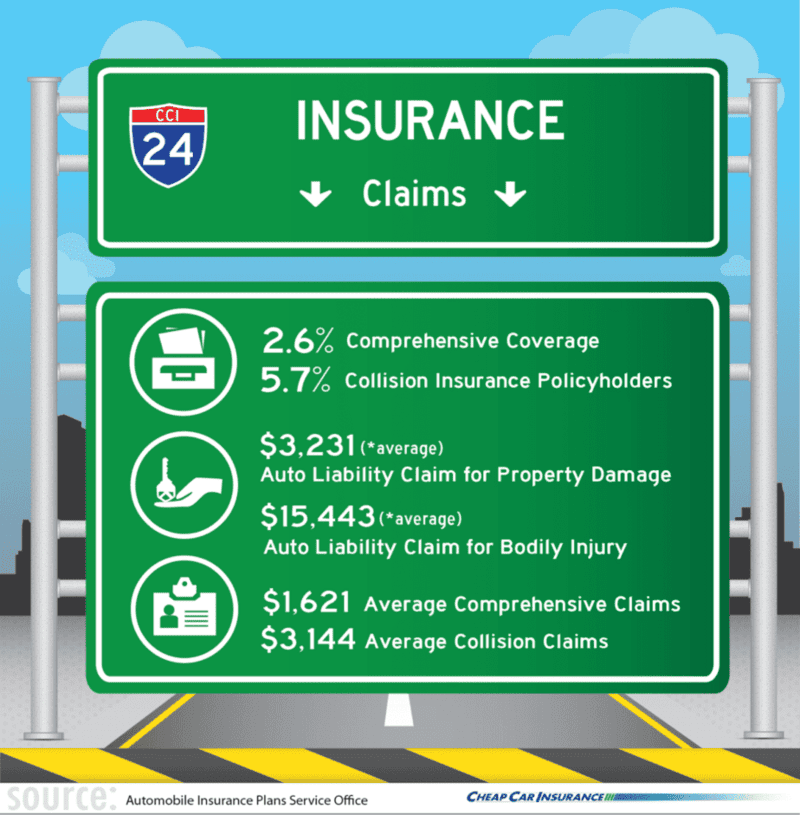
As for the average yearly cost of auto insurance for a sedan, it fell by 0.6% from 2012. This includes collision and comprehensive coverage. According to the National Association of Insurance Commissioners, 76% of drivers pay for the additional comprehensive coverage on top of the required mandatory liability insurance, while 71% opt for collision coverage.
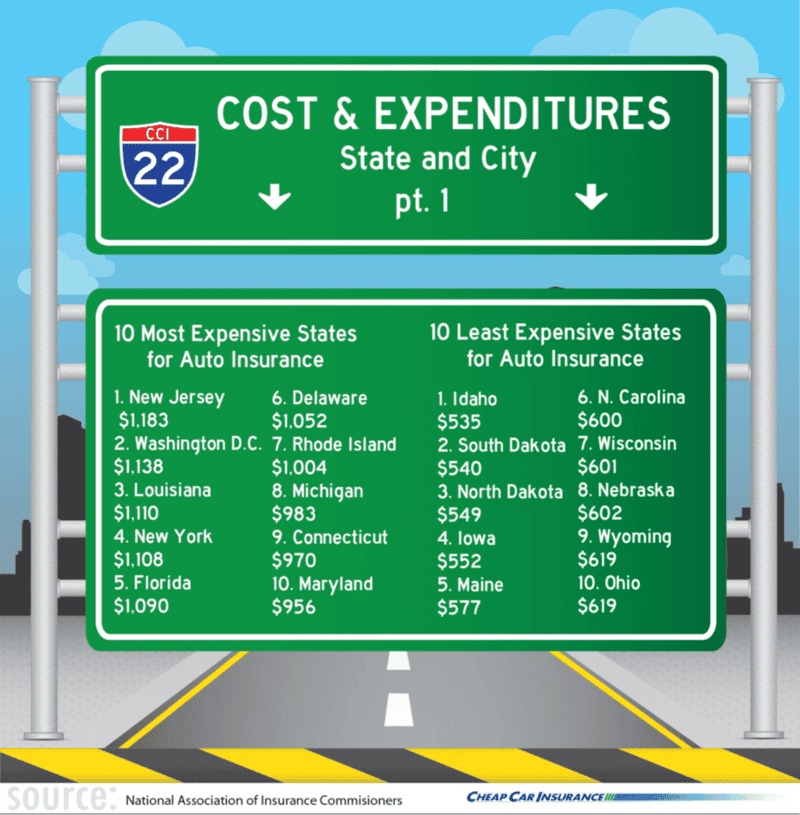
Costs And Expenditures By State And City
According to the National Association of Insurance Commissioners, people are more likely to buy brand new cars in states where the economy is doing well. These brand new car owners are also more inclined to buy physical damage coverage.
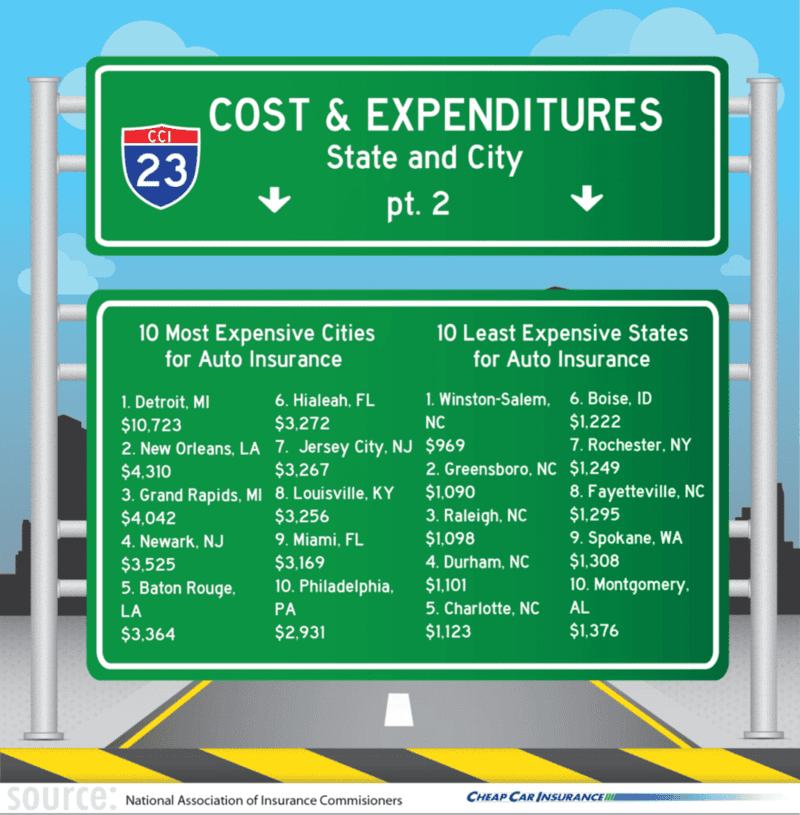
Location is another factor when it comes to premiums. Places that are more populated and with higher per capita income tend to also be high-premium states since the wages in urbanized areas are also higher. The costliest city for auto insurance is Detroit where prices are almost double the amount as compared to the second priciest city, New Orleans. Six of the cities with the cheapest car insurance are in North Carolina with Winston-Salem as the cheapest.
In 2013 alone, the total losses incurred by private passenger auto insurance reached $109.6 billion. According to ISO, less than 1% of those with liability insurance had physical injury claims and only 3.6% had property damage liability claims.
High Risk Markets
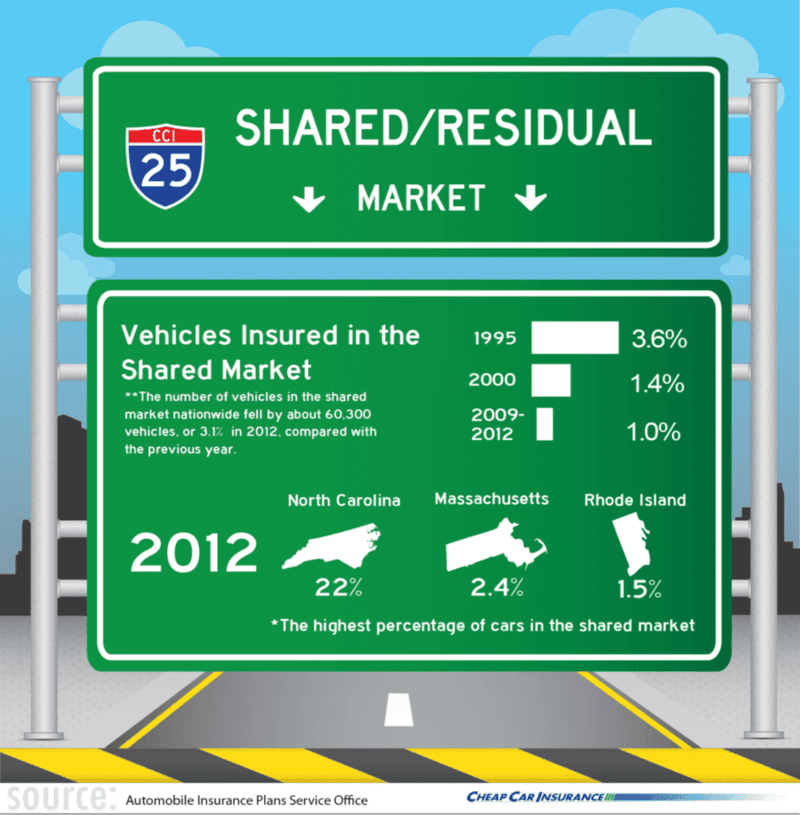
The Shared/Residual Market
All states in the U.S. have put up systems that help give car insurance for those who can’t afford it. They call them assigned risk plans. The insurance industry refers to these as the shared, or residual, market. The percentage of vehicles in the shared market is dropping, however, according to the Insurance Information Institute. One of the reasons why this is happening is because of the decline in the “nonstandard” sector of the voluntary market. This is for drivers with poor driving records or those who drive specialized vehicles.
Auto Insurance Laws
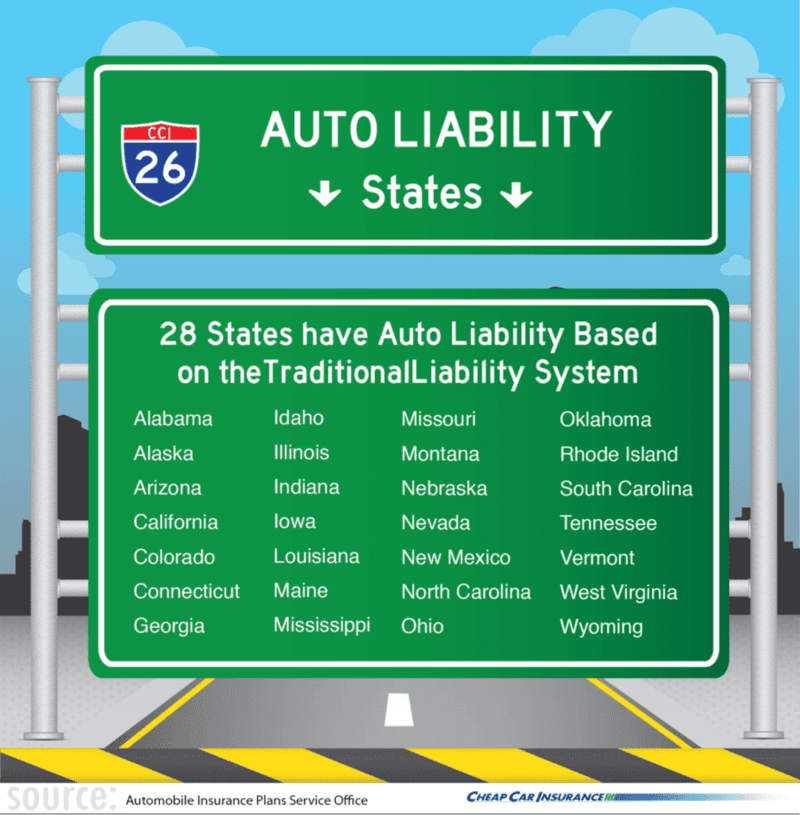
No Fault
The no-fault system is for lowering the cost of car insurance by taking small claims out of the court. In a state with a no-fault law, every insurance company reimburses its own policyholders for minor damages irrespective of whose fault the accident was. This is known as personal injury protection (PIP). PIP coverage is compulsory in no-fault states although the benefits vary depending on which state you’re in. The no-fault states include Florida, Hawaii, Kansas, Kentucky, Massachusetts, Michigan, Minnesota, New Jersey, New York, North Dakota, Pennsylvania, Puerto Rico, and Utah.
Drivers who reside in no-fault states may sue if there are bodily injuries sustained as long as the case meets certain conditions. These conditions are referred to as tort liability threshold. It may be expressed in verbal terms including death or disfigurement or in monetary amounts of medical bills.
“Choice” No Fault
For “choice” no-fault states, motorists can choose out of two options: a no-fault auto policy or a traditional tort liability policy.
Tort Liability
There are no limitations on lawsuits in customary tort liability states. For states with this law, the passenger injured can sue the driver at-fault for any bodily harm, inconvenience, and expenses that he or she sustained during the accident.
Add-on
For states with the add-on policy, drivers can obtain medical coverage and other coverages from their insurance company. The only difference they have in no-fault states is that there are no restrictions on lawsuits. “Add-on” is the term used because these benefits are added to the customary tort liability system. In add-on states, first-party coverage may not be required and the benefits may be inferior to that of true no-fault states. The “add on” no fault states include Arkansas, Delaware, Washington D.C., Maryland, New Hampshire, Oregon, South Dakota, Texas, Virginia, Washington, and Wisconsin.
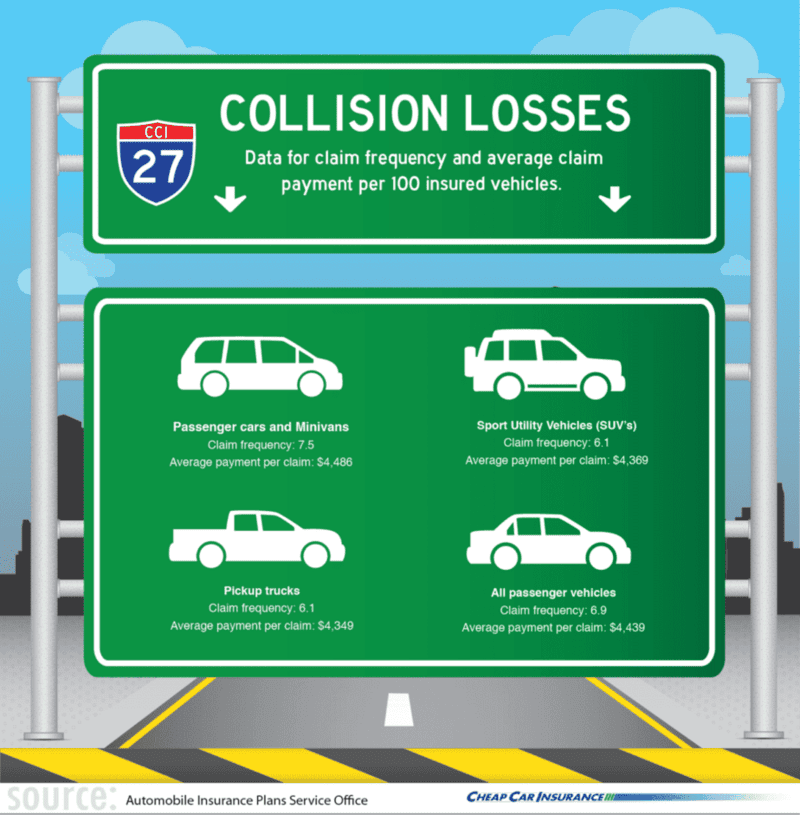
Collision Losses
Take a look at the 2012 data for claim frequency and average claim payment per 100 insured vehicles. (Source: Highway Loss Data Institute)
Conclusion
Paying for car insurance may seem expensive now but getting in an accident without insurance would cost more. Finding the best policy may not be easy since there are a lot of insurance companies in the market, but if you do your research and know what kind of coverage you want, the process is much smoother. Look for an insurance company who can provide personalized coverage instead. This may be better for your budget since you don’t have to pay for unnecessary fees.
A vehicle means more than just a machine to most. It can be one’s symbol of success, the reward for one’s continuous hard work, or even a representation of love for some who received their car as a sentimental gift. Have your car insured and protect not just your vehicle, but also your loved ones as well.
By Aaron Crowe
 Being in a car accident is traumatic by itself. Dealing with the aftermath — such as seeking treatment for your injuries, filing an insurance claim and getting legal advice — can add to the stress.
At a time when you may not know what to do next, it can be difficult to decide if you need a personal injury attorney.
If your car suffers damage in an accident but you don’t, your insurance company should work on your behalf to get you reimbursed, and you probably won’t need a lawyer. But if you’re injured in a car accident, an early consultation with a lawyer may be the right move. An attorney could help you win a larger settlement that goes toward your medical bills following an accident.
Here are seven tips to help you find a personal injury attorney after you’ve been hurt in a car accident.
- Act fast.
The longer you wait to contact an attorney, the harder it gets to take a case to trial. Much of your initial decision may rest on how helpful the other driver is.
If the other driver in your accident is immediately cooperative, you might not need to hire an attorney. But if that person is unhelpful, you may need legal help to get all relevant information.
Many lawyers offer free initial consultations in these types of cases, and consumers should avoid lawyers who don’t, says Andrew Vines, a personal injury attorney in Little Rock, Arkansas.
“In that consultation, the lawyer can discuss your case and let you know whether you have a valid claim that can and should be pursued,” Vines says.
- Do your research.
You may see late-night TV commercials or an ad on the side of a bus for attorneys who claim to collect large payments for people injured in car crashes. Such advertising doesn’t necessarily mean an attorney is good or bad at their job, but their claims should be checked out.
You can research an attorney’s record online at your state bar association or through an online directory at the American Bar Association. Your local or state bar association may also have a lawyer referral service.
Friends and family can also offer referrals, or ask an attorney you’ve worked with in the past.
- Find a specialist.
If you have a specific type of injury, such as a broken back, then a law firm that specializes in your injury can be helpful.
“If you have sensitive injuries or a unique situation, make sure the attorney has been involved in a case like yours before,” says Hamilton Lindley, a personal injury lawyer in Waco, Texas. .
At the very least, find a lawyer who specializes in vehicle accidents, says Lawrence J. Buckfire, a personal injury lawyer in Michigan.
“There are a number of complicated insurance issues involved in auto accident cases, and you need an attorney who has experience and extensive knowledge on those issues,” Buckfire says.
- Interview lawyers.
Talk with your attorney to determine if his skills and experience match your needs, and ask for professional references.
To find the best lawyer, Buckfire recommends asking these questions:
- How long have you been handling car accident cases?
- What percentage of your practice is devoted to car accident cases?
- Which attorney in your office will be handling my case?
- Has that attorney won substantial verdicts in car accident cases?
“Most importantly, you need to feel comfortable with the attorney you work with because the process can take a long time,” Buckfire says.
- Seek trial experience.
Ask how many cases your attorney takes to trial each year versus making settlements.
“While the goal of most cases should be to settle them for a fair amount without the need to go to court, a lawyer with experience in taking cases to court can often do a better job of recovering fair value for your case than a lawyer without trial experience,” Vines says.
A lawyer who has taken cases to trial knows how juries value cases, Vines says. That lawyer would know how to negotiate a settlement.
- Avoid promises.
In the initial consultation, you want a lawyer who will be straightforward with you about the litigation process and pros and cons of pursuing a case, Vines says. But don’t listen to promises that you’ll be rich or that you’ll even win the case, he warns.
Compensation or full financial recovery in cases is never guaranteed.
“Any lawyer who makes a promise about what you can recover should be avoided,” Vines adds.
- Know your costs.
Your auto insurance company won’t pay for you to hire an attorney to file a lawsuit after an injury.
Most personal injury attorneys work on a contingency basis, meaning they don’t get paid unless the client wins. Payment varies by state, but in general lawyers collect one-third of a personal injury settlement or judgment. You shouldn’t pay anything if the case is lost.
Some lawyers may ask for upfront costs, regardless if they lose the case.
By Aaron Crowe
 Driving through a parking lot can feel almost as stressful as driving on a busy freeway. With cars backing out of parking spaces and people walking through with their attention on their phones, even the slowest driver needs to be extra wary.
Parking lot accidents are common, with about 20 percent of all auto accidents taking place in parking lots. Serious damage to your car is unlikely, though you could develop physical injuries such as whiplash days later.
Since the damage is often minor, both drivers may be inclined to not report it to police or their insurance companies. That can be a mistake for many reasons. Here are some steps to take after you’ve been in a parking lot accident:
- Everyone OK?
Injuries from parking lot accidents are uncommon, but the first thing to do is check that you and the other driver aren’t injured, says Will Smith, a personal injury attorney in Atlanta who has represented clients involved in parking lot crashes.
“Because they’re going so slow a lot of times, they’re not injured,” Smith says. “But it happens.”
If you’ve been injured or feel pain, you should seek prompt treatment. Call an ambulance if needed. Your adrenaline may prevent you from feeling symptoms of certain injuries such as whiplash, Smith says, so it could be worthwhile to go to your medical provider and get checked out.
“Seemingly minor accidents can turn into major health issues,” says Cade Parian, a personal injury attorney in Atlanta.
- Don’t argue
Anger and frustration are common after an accident, but don’t argue with the other driver over whose fault it is. It can lead to a physical fight, which no one wants, or at the least to someone saying something they’ll regret — such as being at fault.
- Gather information
Just as you would in any other auto accident, you’ll need to exchange names, addresses, phone numbers and insurance information after a parking lot accident — even if you consider it a small accident that won’t need repairs.
It may be too early to tell if your car has been damaged. There may be internal damage that isn’t apparent yet, or you may be too shaken up to notice it.
Having this information will help your insurance adjuster work on your behalf. Either call your insurance company from the scene or wait until you get home.
You should also get contact information from witnesses, if there are any, and take photos with your phone of the scene and the other car, including its license plate, Parian says.
- Call the police
Parking lot accidents generally occur on private property, so police may not issue a citation to the offending driver, Smith says. Police may not even respond to such an accident unless someone is injured, and they may not issue a police report.
Still, it’s worthwhile to call police after a parking lot accident, because they may come out and file a report, Smith says. A police report can be a tremendous help to your insurance company.
In Georgia, drivers can ask police to prepare a “Georgia Uniform Motor Vehicle Private Property Accident Report,” Smith says. The document will record pertinent information about the accident and will be useful later to insurance companies.
Even if neither car is damaged and both parties are uninjured, filing a police report can help if either side claims injuries months later.
“Your insurance company is going to rely a lot on what that responding officer reports,” Parian says.
- Call your insurer
We mentioned this earlier, but after these initial steps have been taken, it’s time to call your insurer and let them know you’ve been involved in an accident — no matter how small.
Almost all insurance policies require that the insured report accidents. It’s part of your contract with your insurer to cooperate with them. Without it, you could lose coverage.
If you’re at fault in the accident, you’ll have to pay your deductible and you’ll be assigned points, which will cause your insurance rates to rise.
However, a minor accident in a parking lot may be one of the few times when it’s worthwhile not to file a claim. You could pay for the damage yourself if the repairs cost less than the deductible.
Backing up out of a parking space is the most common parking lot accident, Smith says. If you backed your car into another car, you’ll probably be found at fault.
Some parking lot accidents could come down to your word against the other driver, when insurance companies could split the fault in half. Each person would pay their deductible and no points would be assigned.
- Contact an attorney
This is an optional step, but one you may need if you’re injured and the at-fault driver’s insurance company won’t pay for your medical care.
Contacting an attorney quickly is important to help document the accident, Smith says. For example, a business may not give you videotapes of the parking lot accident, but an attorney can subpoena the camera evidence for a lawsuit, he says.
A lawyer may also be needed to help determine if the property owner is at fault by not having good signage, striping or room for cars to park safely, Smith says.
A parking lot accident shouldn’t be a time to panic. The damage to your car will probably be minor, and hopefully no one is injured. These steps should help make the situation a little easier to deal with, allowing both drivers to return to the search for the best parking spot.

Driverless cars are in the works for multiple companies, from Google to Tesla. Proponents say the vehicles will ease road congestion, reduce energy consumption and emissions, and drastically decrease the rate of car accidents. So, is it time to let artificial intelligence take the wheel?
To find out what people really think, we surveyed 2,000 people in the U.S. – and tackled all sorts of tricky issues. How do people feel about artificial intelligence? Would anyone actually buy a driverless car? And what about all the moral issues that arise regarding fatal accidents, fault, and the trustworthiness of technology? We’ll steer you through the details below.
Driverless Cars: A Must-Have Purchase?
 Once a pipe dream, autonomous car technology is currently speeding toward the finish line. Companies like Google, Audi, and Mercedes-Benz are already testing the cars in certain cities. It’s too early to put a down payment on one – but once the companies roll out these vehicles, would you buy one?
Only 35% of our survey respondents said no, while almost 41% said yes. Nearly a quarter are simply undecided on the issue. When the cars are ready, who appears most likely to purchase? Men. Almost 50% of men said they were poised to purchase a driverless car while only about 30% of women were open to it – perhaps not a bad thing given that men are more likely than women to engage in risky driving habits.
Whose Life Would You Risk?
You’re not in the driver’s seat – so if something goes terribly wrong, it’s not technically your fault, right? We asked survey participants to come clean about whether they’d rather risk death by driverless car or risk taking another life.
Across the board, over 8 in 10 participants said they’d chance death themselves rather than risk a human life – and especially the life of a child. Amazingly, 2 out of 10 respondents would put their own lives in peril to avoid hitting an animal.
Men vs. Women: Would You Risk Your Life?
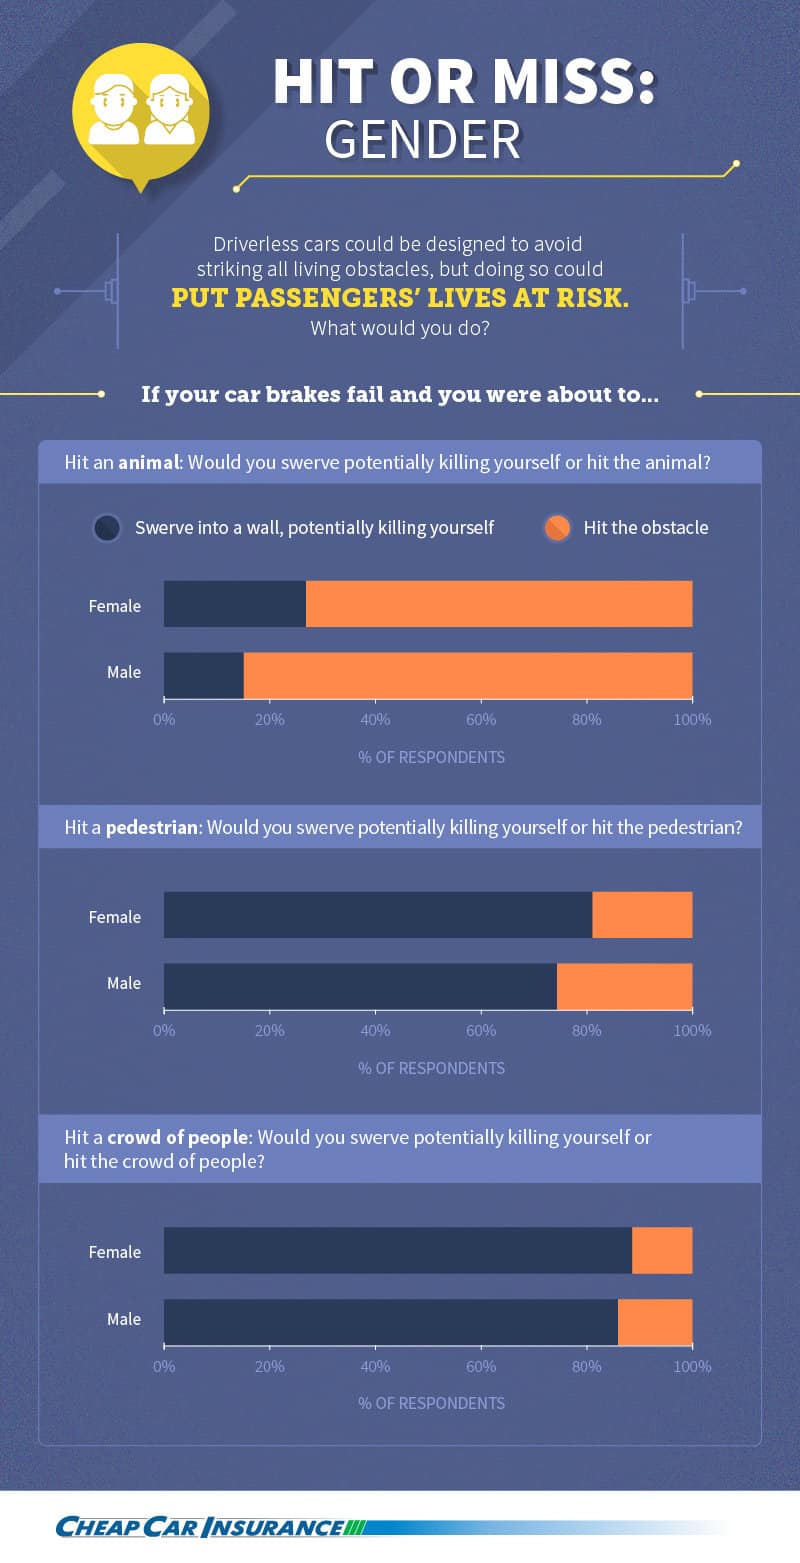
During testing, driverless cars have been involved in some human-error accidents – and one even caused a collision. We asked respondents some tough questions about driverless car accidents – specifically, whether they’d rather risk their own lives for the lives of others. Then we broke down the results by gender.
Across the board, results reveal men are more focused on self-preservation than women. Nearly 85% of men would hit an animal rather than risk their own lives, but only 73% of women would. Almost 26% of men would strike a pedestrian rather than risk death, but only around 19% of women would. And almost 14% of men would plow into a crowd rather than gamble their own safety, while only about 11% of women would.
Trust Issues: How People Feel About Technology
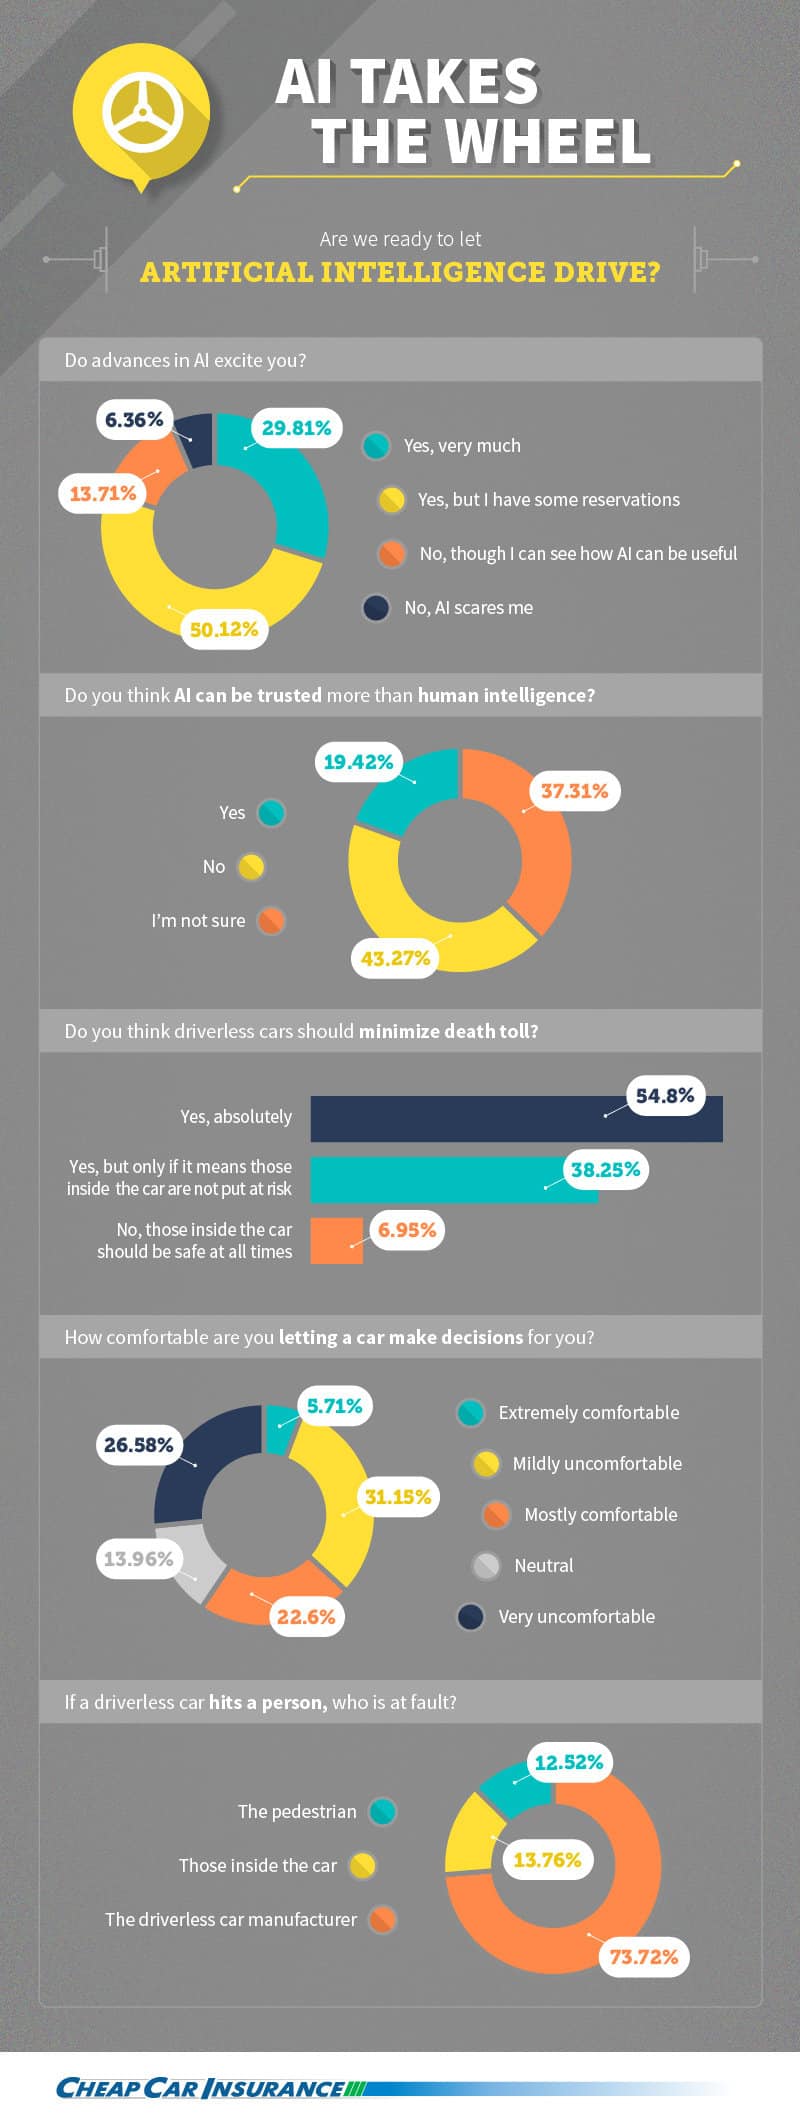
In the scheme of things, the concept of driverless cars is relatively new and foreign. We wanted to gauge people’s honest feelings on just how trustworthy they find this technology.
About 8 in 10 respondents said they’re excited about driverless car technology – though 5 of the 8 admitted to having reservations. Fewer than 1 in 10 find it downright scary. When asked to consider human brains vs. artificial intelligence, only 19% trust AI more. 43% trust human intelligence more, and 37% are undecided.
When asked if driverless cars should minimize the total death toll at all costs, 55% said yes without reservation. Another 38% said only if those inside the car are not put at risk, while 7% thought safety of those inside the car should be the No. 1 priority.
A full 58% of respondents were at least somewhat uncomfortable letting a car make decisions. And when posed an ethical question that’s stirred controversy and made headlines, the result is quite surprising: If a driverless car hits someone, nearly three-quarters of respondents place the blame on the car manufacturer. Another 14% blame those inside the car, while 13% fault the pedestrian.
Should Safety of Those Inside the Car Come First?
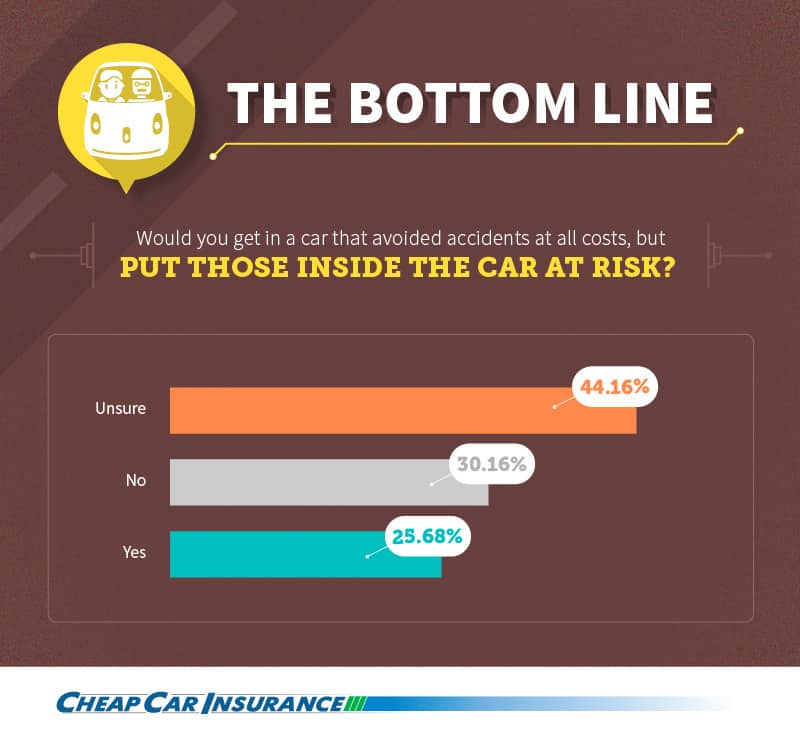
Our final question cut to the chase: If a driverless car put those inside the car at risk but avoided accidents no matter what, would you ride in one? Over 44% of respondents weren’t sure, just over 30% said no, and almost 26% said yes.
Driving Toward the Future
Our survey reveals some fascinating feelings from potential passengers of driverless cars. Men are more interested in buying driverless cars – and compared with women, they are also more focused on saving their own lives rather than the lives of others. However, the majority of people would prioritize pedestrians’ lives over their own.
Overall, people appear pretty undecided over the trustworthiness of driverless car technology. Many aren’t quite comfortable letting artificial intelligence take the wheel. And if something should go wrong, the majority of people would place the blame squarely on automakers.
Ready or not, it appears driverless cars are on the way – but are they really going to revolutionize transportation as we know it? That remains to be seen.
Methodology
Our survey was hosted on Survey Monkey and was distributed to respondents using Amazon Mechanical Turk workers based in the United States. 2,000 responses were gathered.
Sources
- https://www.washingtonpost.com/news/the-switch/wp/2016/02/05/why-you-should-consider-getting-a-driverless-car-in-1-chart/
- http://www.ctvnews.ca/autos/how-safe-should-driverless-cars-be-before-they-hit-the-road-1.2821391
- http://www.iihs.org/iihs/topics/t/general-statistics/fatalityfacts/gender
- http://www.bloomberg.com/news/articles/2015-12-18/humans-are-slamming-into-driverless-cars-and-exposing-a-key-flaw
- http://www.wired.com/2016/02/googles-self-driving-car-may-caused-first-crash/
- http://www.theatlantic.com/business/archive/2014/04/who-is-at-fault-when-a-driverless-car-gets-in-an-accident/361250/
Fair Use
Feel free to share the images found on this page freely. When doing so, please attribute the authors by providing a link back to this page, so that your readers can learn more about this project and the related research.
By Craig Guillot
 Motor vehicle fatalities on U.S. highways reached an 8-year high in 2015, and insurance experts say it could lead to higher auto insurance premiums in the coming years.
The National Safety Council recently released preliminary estimates indicating motor vehicle deaths rose by 8% in 2015. The council projects there were 38,300 deaths and 4.4 million serious injuries on U.S. roads last year. It represents the highest death toll on record since 2008 and the largest year-over-year percentage increase in fifty years.
Insurance industry experts say that as the number and severity of accidents rise, higher auto insurance premiums can also follow. Joan Schmit, Distinguished Chair of Risk Management and Insurance at the University of Wisconsin-Madison, says a rise in accidents will “absolutely affect premiums.” Schmit says insurers often raise premiums to cover loses or if they anticipate more claims in the near future. “Losses are a big component of what goes into premiums, and any time they rise insurers will likely raise premiums as well. More accidents means more losses,” says Schmit.
Serious accidents can result in significant claims for insurers. According to data from the Insurance Information Institute, the average auto liability claim in 2014 was $3,290 for property damage and $16,640 for bodily injury. Claims for fatal accidents can rise well into the tens of thousands of dollars, even hundreds of thousands, depending on the coverage of the at-fault party.
One major national insurer noted in federal filings in the past year that it has already seen a decline in underwriting profits and was “implementing rate increases as needed.” The insurer reported that its profits tumbled by 40% between 2014 and 2015.
Investor Warren Buffet also said on CNBC in late-February that insurance premiums would rise because of the increase in accidents last year.
“Rates will have moved up and you will see it as you get renewals…both because the frequency of accidents has gone up and the cost of accidents has gone up,” said Buffet in the interview.
Another major carrier had already raised premiums in the second quarter of 2015 due to a nearly 50% decline in auto insurance profits. At the time, the CEO attributed it to a rise in accidents.
Dave Cather, clinical professor of risk management at Penn State University in University Park, Penn., says the potential for premium increases “will largely depend on the insurer.” Cather says insurers have “varying levels of sophistication” in how they use data to forecast risk and losses. He also says insurance companies are secretive with their calculations and don’t publicly announce numerical correlations of how those risks impact premiums. While it’s hard to say how quickly and by how much, Cather says if accidents and fatalities are on the rise, higher premiums “will likely follow.”
Cather attributes the rise in injuries and fatalities to more miles being driven, something he says is likely fueled by lower gas prices and an improving economy. The U.S. Department of Transportation recently reported that 2015 was the most heavily-traveled year in history with drivers traveling more than 3 trillion miles, a 3.5% increase over 2014.
“People are simply driving more miles and the more miles driven, the more accidents there will be. Insurers may expect more losses,” says Cather.
Schmit says insurers will also consider loss data and weigh premium increases on a state level. While motor vehicle deaths were 8% higher for the year nationwide, those rates varied dramatically by state. The NSC estimates that the states that saw the biggest increases in fatal accidents were Oregon (27%), Georgia (22%), and Florida (18%). Yet, thirteen states also saw a reduction in fatal accidents, the greatest decreases happening in New Mexico (-20%), Kansas (-7%), and New Jersey (-2%).
“Location really matters as rates tend to be state-based and more location-specific. There can even be big differences in different parts of a state,” says Schmit.
Schmit says it can take “up to a couple of years” for drivers to see higher premiums. That delay is because drivers typically renew a policy every six months and because insurers must also have rate increases approved by state regulators. It means drivers in such states as Oregon, Georgia and Florida could see higher premiums on their next auto insurance renewal.
“It can take a while. Some drivers [may already be seeing premium increases]. There’s a regulatory aspect associated with it and it really depends on how quickly regulators allow insurers to increase their prices,” says Schmit.
By Craig Guillot
 Renters in some cities may be paying significantly more for auto insurance than homeowners.
A new analysis by the Consumer Federation of America of auto insurance premiums reveals that major auto insurance companies can charge drivers as much as 47% more for basic liability insurance if they do not own their own home.
The CFA used a profile of a 30-year-old female motorist with good credit, a perfect driving record and a 2005 Honda Civic. They then obtained insurance quotes from seven of the nation’s largest auto insurers in ten cities. On average, the renter was quoted a premium that was 7% higher than that quoted to a homeowner.
“It unfairly discriminates against lower income drivers. It shouldn’t matter if a good driver rents or owns their own home,” says CFA Insurance Director Robert Hunter.
Michael Barry, vice president of media relations at the Insurance Information Institute, says many insurers have simply found through data and analytics that homeowners tend to have fewer losses in the auto insurance market. Homeownership status is used in conjunction with a variety of variables that range from credit score to marital status and education.
Barry says it’s not that renters are penalized, it’s that homeowners are often given discounts. “In some cities, renters may pay more simply because the homeowners are being given a discount because the insurer may have better loss experiences with homeowners,” he says.
The CFA study revealed that premiums can vary widely by city and insurer. One insurer showed no premium differences between renters and homeowners while another quoted renters an average of 19% more. The top two cities where renters paid higher premiums than homeowners were Louisville, Ky., and Tampa, Fla.
“There’s a remarkable difference between companies, and even within a company between cities. It makes you wonder about the soundness of these factors because you’d think the company has the same underwriting criteria in pretty much every state,” he says.
Robert Hoyt, Ph.D., professor of risk management and insurance at the University of Georgia in Athens, Ga., says insurers are highly secretive about how they calculate their premiums. While insurers may have data indicating higher loss rates for renters, he suspects insurers could also see an element of “stability” tied to homeownership. Those homeowners may be more inclined to bundle the auto insurance with their homeowners insurance, they may be less likely to move as often, and they may have higher rates of multi-vehicle policies. Because the cost of acquisition can be high, insurers make their best profits by holding policies for longer periods of time.
“They want people that are going to stick around for a few years. I suspect some find that [homeowners] are more profitable and attract them with lower rates,” says Hoyt.
Homeownership status is just one factor in hundreds of combinations used to determine premiums, says Lars Powell, PhD, Director of the Alabama Center for Insurance Information and Research at the University of Alabama in Tuscaloosa, Ala. Powell says in the highly-competitive auto insurance market, insurers have a vested interest in offering the lowest possible premiums to ensure a profit based on their risk calculations.
Powell says many insurers also have preferred markets and can price policies higher for segments of the market they deem less profitable. It’s why insurers can have drastically different premium quotes for the same driver. Powell says while some companies may prefer to do business with and can offer lower premiums for high-risk drivers, others may tweak their premiums to attract more homeowners than renters.
 “It’s not a bad thing or something that warrants public policy solutions. It’s just what insurers do to ensure their rates are accurate and that they can make a profit for [forecasted losses]. I tell consumers to shop around because are always insurers that want your business more than others,” says Powell.
Some insurers don’t view homeownership as a factor in premiums. One major insurance company in the study did not quote any difference in premiums between homeowners and renters in any of the ten cities. Another insurer even quoted a premium that was 11% less for renters in Chicago.
Barry says regulatory environments in different states can also impact how insurance companies determine risk and premiums. In California, for example, insurers are prevented by consumer protection laws from using homeownership status.
Nevertheless, higher premiums for renters can have a “profound impact” on the poor because it forces them to pay a larger portion of their income for insurance, says Hunter. According to data from the Federal Reserve, renters have a median income of $28,000 compared to $63,000 for homeowners. “A big impediment on poorer people being able to buy a car is often the insurance. How can you ask someone, who has good credit and a clean driving record, who is making $12,000 per year to pay, $2,500 when an MBA who owns her own home pays $580,” says Hunter.
The CFA is calling for regulators and policymakers to end the use of homeownership and non-driving factors in setting premiums. Hoyt says shopping around remains the best way for renters to avoid paying more than they should because premiums can vary significantly.
“Pricing models are becoming more granular and there’s increasing competition in most states. Look around online, call an agent. Consumers have plenty of options nowadays.
By Aaron Crowe
 A move by the Federal Reserve late last year to slightly raise interest rates shouldn’t be a reason for potential car buyers to rush out and buy because they’re worried car loan rates will rise.
That’s the good news, lending experts say, especially at a time when car loans are so cheap: Five-year loans cost less than 2.5 percent for a new car and around 2.75 percent for a used car, according to recent figures from Bank of America.
The bad news is that over the next year or so, auto loan rates may rise, and the days of zero percent financing for new car loans could be ending sooner than you’d think.
After 10 years of not moving the federal funds rate — the internal interest rate banks are charged for borrowing money — the nation’s central bank raised it in mid-December from 0.25 percent to 0.5 percent.
The increase is likely to trickle down to loans for homes, small businesses, credit cards and cars.
The recent move may not have much short-term impact, but if the Federal Reserve continues raising interest rates, even slowly, then loan rates could also increase.
“The Fed may have been a little overly optimistic when they bumped up rates,” says Kirk Chewning, owner of Cane Bay Partners, a management consulting company.
The stock market struggled in early 2016, and the Fed may lower rates in the coming months to help improve the economy, Chewning says.
Only $171 more over 5-year loan
In hard numbers, a slight increase in the annual interest rate on a car loan doesn’t affect the cost much.
The vCalc blog gives the example of borrowing $25,000 to buy a new Honda Accord at two interest rates — 4.67 percent and 5.17 percent (which is 0.25 percent on top of the normal rate due to the Fed’s hike). Both loans are for 60 months.
For the 4.67 percent loan, the monthly payment is $468.01. The total cost with interest is $28,080.60, with $3,080.60 of that in finance charges.
After the Fed hiked the rate, a 4.92 percent loan would have a monthly payment of $470.87, or $2.86 more than without the rate hike. The total cost would increase by $171.60 total to $28,352.20.
The vCalc site doesn’t get into used-car loans, which are usually higher than new-car loans and are at rates that move slower.
Buy now?
The potential for future interest rate increases is higher with the Fed’s move, but that shouldn’t be a main concern when considering buying a car, says Robert R. Johnson, president of The American College of Financial Services in Bryn Mawr, Pennsylvania.
“I wouldn’t let interest rates be the decision-driver, but certainly auto loan rates will rise in the future as the Fed raises interest rates,” Johnson says.
Interest rates may go up in the next year or so, making this a good time to take advantage of low loan rates, Chewning says.
“Now is a great time to be buying a car from the standpoint of interest rates,” he says.
Zero percent loans going away?
Some auto dealers are still offering zero percent financing for new cars, giving a free loan for up to five years. Such loans may become less prevalent if interest rates rise, Chewning says, but are smart offers from dealers who want to bring in customers.
“If you can find zero percent financing, that’s a great way to go,” he says.
However, dealers may just increase the new car’s price to make up for not making a profit on a loan, Chewning says.
“A deal may be there, but you need to understand the car price,” he says.
The best place to get a car loan if you can’t find zero percent financing? Your local credit union. Most credit unions have expanded their membership requirements to allow more people to join.
“Credit unions many times provide some of the best rates that are out there,” Chewning says.
By Aaron Crowe
 Five years after Arizona outlawed payday loans, lenders have replaced them with auto title loans that are just as expensive for borrowers, according to a new report.
With an annual percentage rate of 204 percent on loans of $500 or less, car title loans look similar to payday loans, with one major exception — borrowers can have their car repossessed if they don’t pay. And in Arizona and other western states that lack good public transportation, losing your car can mean losing your job if you can’t get to work.
Payday and auto title loans are often used in emergencies, and both charge exorbitant interest rates — but a car title loan requires the collateral of a car owned by the borrower, while a payday loan requires pledging your next paycheck.
The report released jointly in January by two groups — the Consumer Federation of America and the Southwest Center for Economic Integrity — found that after Arizona’s law authorizing payday loans expired in 2010, many payday lenders became auto title lenders. The state’s Proposition 200 ballot vote in 2008 that shut down payday lending didn’t affect auto title loans.
Today, Arizona has more than 630 title loan locations, growing from 159 locations in 2008. Title loans are available in half of the states in the U.S., the report found, and are concentrated in the South and West regions. States in New England and the upper Midwest generally prohibit the loans.
The Center for Responsible Lending estimated in 2013 that car title lenders generate nearly $2 billion in loans annually, with borrowers paying more than $4 billion in fees.
How car title loans work
To get a title loan, the borrower must own his or her car outright and possess the title. The car’s title is signed over to the auto title loan company until the loan — typically $1,000, according to the Pew Charitable Trusts — is fully repaid.
Payment is either due in a single payment after one month or repaid in installments over two years. Pew reports that loan customers spend about $1,200 per year in fees for loans that average $1,000, paying a typical 300 percent APR.
Some states, including Arizona, also allow “registration” loans where a clear title isn’t needed for a loan, only an auto registration card.
Typically, up to 25 percent of the car’s value can be borrowed in a title loan, says Delvin Davis, a senior research analyst at the Center for Responsible Lending.
If the loan isn’t paid on time, the car may be repossessed immediately. Or, a title lender may allow a borrower to only pay the interest for 30 days, rolling over the loan each month indefinitely.
“Once you get into a car title loan or a payday loan, it’s really hard to get out of,” Davis says.
The high costs
The loan interest rates are high enough, but not paying the loan on time only increases the final payout. The average borrower renews a one-month title loan eight times, the report found. A $500 loan renewed eight times costs $765 in finance charges for a total payment of $1,265 after nine months.
The report lists three examples of Arizona’s tiered rate cap for title loans:
- A $500 loan at 204 percent APR to be repaid in one month would cost $85 for a total payment of $585.
- A $1,248 installment title loan, costing 180 percent APR and repaid in 52 biweekly installments, has a finance charge of $3,228 for a total payment of $4,476.
- A $5,106 loan costing 108 percent APR and repaid in 24 monthly installments has a $7,551 finance charge for a total payment of $12,657.
Who gets these loans?
Unlike many bank loans where a car can be used as collateral and the borrower’s ability to repay the loan while meeting other financial obligations is checked, title loans are asset-based and only require a car title.
“No credit, no problem” is often touted by title lenders, and many don’t conduct credit checks, according to the report. Proof of income isn’t required.
Customers are typically poor, underbanked or unbanked, and use the loans to cover regular expenses, the report found. Title and payday loan borrowers have a gross annual median income of less than $30,000, according to Pew findings.
Borrowers typically follow payday loans with title loans, says Stephanie Reeves, a credit counselor at ClearPoint Credit Counseling Solutions who once worked for a payday lender.
If they can’t afford payday loans, they’ll sometimes close their bank account so the lender can’t get to their next paycheck, Reeves says.
As a lifeline to employment, making on-time payments for a car loan can be vitally important. During the Great Recession, auto loan and credit card bills were paid by most people before they paid their mortgage, says Mitchell D. Weiss, an adjunct professor of finance at the University of Hartford Barney School of Business in West Hartford, Connecticut.
For the working poor, title loans may be their last and only option, Weiss says.
“I see auto title loan borrowing almost as a last resort,” he says. “All of these products, they prey on those who could least afford a hiccup.”
Other options
Banks are the lowest-cost lenders, and even getting a cash advance on a credit card is cheaper than a title loan.
A bank, however, may not want a car as collateral, Reeves says, and will want a borrower to have good credit.
A lot of her customers have good credit, Reeves says, but they need $1,000 or so to pay off credit card debt without having to get a bank loan that their spouse may learn about as a joint account holder.
“A lot of my customers were hiding things,” she says, such as debt from spouses or employers.
Tax refund season, from January to April, is a common time to pay off Christmas debts or car title loans, Reeves says.
Davis says his organization steers people to traditional banks, credit unions and credit cards — which are all regulated on a federal level — instead of title loans.
“That lump-sum payment really traps people,” he says.
By Aaron Crowe
 You may have noticed the legal wording at the bottom of car commercials where an unseen driver is effortlessly speeding around snowy corners: “Professional driver on closed course. Do not attempt.”
Unless you’re used to driving in reverse at 50 mph, the caution is there for a good reason — they’re driving in ways that most people don’t.
Granted, some of what they’re doing in TV commercials is enhanced with computer-generated imagery, but also requires professional drivers. Stunt drivers also do maneuvers in TV shows and movies that require them to take a vehicle to the edge of losing control.
While everyday drivers may not need to perform bootleg turns, do a reverse 180 or slide around corners, some stunt driver moves can come in handy during emergency situations such as car jackings or driving on wet roads.
Here are seven things that everyday drivers can learn from stunt drivers. Just remember this disclaimer, which Wyatt Knox, special projects director at Team O’Neil Rally School, which trains stunt drivers, told us: Don’t try these maneuvers at home. Only attempt in safe, open areas, and preferably with a professional instructor on a closed course. Some maneuvers in a high center of gravity vehicle can cause a rollover.
- Be a precision driver.
This means knowing where every point of your car is and how to manage that space, says Chuck Hawks, a retired pro racer who owns Teen Driving Solutions School.
“Stunt drivers are precision drivers — where speed matters less than accuracy,” Hawks says. “They are very aware of where their tires are physically touching the ground and where their car’s body ends and the surroundings begin.
“Having reference points on the car from your perspective in the seat is critical,” he says. “Precision drivers know how to manage that space well. They also have keen awareness of what the car feels like when it’s on the edge of traction.”
A layperson who studies these things and improves with practice is bound to be a better driver overall, especially when moving in tight quarters, Hawks says.
One simple way to do this is to follow the advice of “You go where you look, so look where you want to go,” Hawks says. That means looking as far as you can see the pavement. That doesn’t mean to lock focus there, but to look as far ahead as they want the car to end up as possible, he says.
- Throttle oversteer.
If you’ve ever driven around a corner in the rain and your car has started sliding or fishtailing, and you were able to control it, then you’ve done a bit of stunt driving. This is one of the main times when looking where you want to go will help you naturally steer in that direction.
Throttle steering, also known as “power sliding,” can exaggerate this sliding with a rear wheel drive car on a slippery surface, or in a vehicle with a lot of power. It may not help you drive out of fishtailing, but can make you feel like you’re driving in “Tokyo Drift” or the “Dukes of Hazard.”
Accelerating aggressively on a wet road while turning will cause the rear wheels to spin and some dramatic oversteer — when the back end of the car loses grip and slides sideways while the front maintains traction, Knox says. Always look to where you want to go and “be prepared to let off the throttle if it all starts going wrong,” he says.
- Reverse 180s.
You may drive upon a scene where you quickly want to get out of the situation by turning around in reverse. It happened so often to Jim Rockford in the TV show “The Rockford Files” that it’s also named the “Rockford turn.”
“This is essentially when a forward traveling vehicle comes to a stop, reverses up to speed, spins around, and ends up going forward again in the opposite direction,” Knox says.
The key is to reverse up to a decent rate of speed, let off the gas and turn “left hand down” aggressively when you make your move so you’ll end up where you want to be and not in the ditch, he says.
It’s also important to shift quickly and properly to pull this move off smoothly and without damaging your transmission, Knox says. The move can be dangerous in vehicles with a high center of gravity that are prone to rollovers, he says.
- Forward 180s.
Also known as “bootleg turns,” this is another evasive maneuver where a forward traveling vehicle slows down, spins around to end up facing the opposite direction, then accelerates again.
“All you really need to do there is get slowed down to a reasonable speed, release the brakes and pull the handbrake, turn in the desired direction, let the car rotate, put the handbrake down and drive away,” Knox says.
- Handbrake turns.
Ever wonder how cars slide into parking spaces in dramatic fashion in car commercials? Precision drifting even looks cool with a remote-controlled car. To do this with a real car, handbrake turns or “e-brake turns” are useful.
Most cars have parking brakes that work on the rear wheels, Knox says. Most stunt cars — such as rally cars, drift cars and other racing cars — are modified to work this way if they don’t from the factory, he says.
“Pulling the handbrake while you’re moving will cause the rear tires to lock up, again causing the back end to slide sideways,” Knox says.
Vehicles that don’t have throttle oversteer (our second tip), such as four-wheel or all-wheel drive, can use handbrake turns. The method is used for dramatic parking jobs in car commercials, initiating higher speed drifts, and generally getting a car to slide sideways easily, Knox says.
If you’re driving a rear-wheel drive vehicle with a manual transmission, don’t forget to push the clutch in during the maneuver, and that handbrake turns can be dangerous at high rates of speeds and in high center of gravity vehicles.
- Slightly under inflate tires for better control
It sounds counterintuitive, but keeping your vehicle’s tires 10 percent under the recommended pounds per square inch, or PSI, given on the tire wall will help give your tires more control, says Jason Hanson, author of “Spy Secrets That Can Save Your Life.”
Control is important during evasive driving, and it comes from your tires, Hanson writes in his book. Most people drive with underinflated tires, he says. Using 10 percent less air in them gives you better control and improves gas mileage, he says. So if your tire recommends 44 PSI, then inflate it to 40, Hanson recommends.
- Hand and seat position.
Proper hand positioning on the steering wheel is important, Hanson says, and can help in evading roadblocks or when someone is in front of your car.
He recommends positioning at the nine and three o’clock areas, which forces you to keep your elbows bent and to get the most mobility out of your car. If someone is standing in front of your car trying to block you, having your hands in these positions can easily allow you to maneuver your car around him, Hanson says.
The car seat position is also important. Many people are often too far from the steering wheel, Hanson says.
He recommends putting your arm straight out toward the steering wheel and resting your arm on top of it. The bottom of your wrist should rest on top of the steering wheel.
If your fingers are touching the wheel then you’re too far back. If your forearm is on the wheel then you’re too far forward.
All of these tips may not be enough to avoid an ambush or get through a hairpin turn or even a left turn safely if you’re driving too fast, but if you at least look ahead to where you’re going, you’ll get there.
And remember, don’t practice these at home. Hire a trained professional to teach you.

Malfunctioning air bags. A faulty fuel system. Defective lighting. Various issues can prompt recalls in the world of automotive, but not every single one makes headlines. For the most part, many of us are in the dark about which vehicle brands, models, and components are recalled most frequently.
To get a better understanding of auto recalls, we analyzed data from the National Highway Transportation Safety Administration (NHTSA) database for recalls of 20 top car brands. To support our first analysis, we also used CarQuery’s API to determine how many types of models were produced per year for each brand. Which cars are recalled most often according to this data? Which vehicle components are often involved? And how do these recalls correspond with sales numbers?
Analyzing Recalls by Car Brand
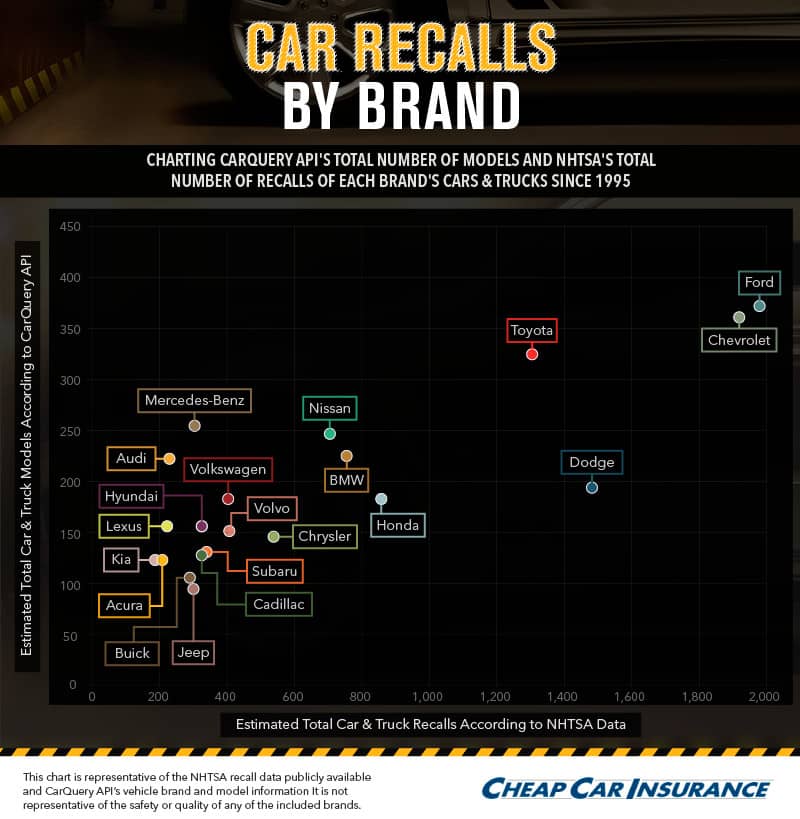
Breaking down the recall list by brand reveals an interesting snapshot of affected automakers. Most of the car brands seem to follow the same pattern: the more models created, the higher the number of recalls. However, based on the Car Query API data reviewed, Dodge has half as many models as Ford or Chevrolet, but almost as many recalls. On the other side of the spectrum, Toyota has had nearly as many models as Ford and Chevrolet since 1995, but over 600 fewer recalls, according to the NHTSA data.
Which Car Model Has Had the Most Recalls?
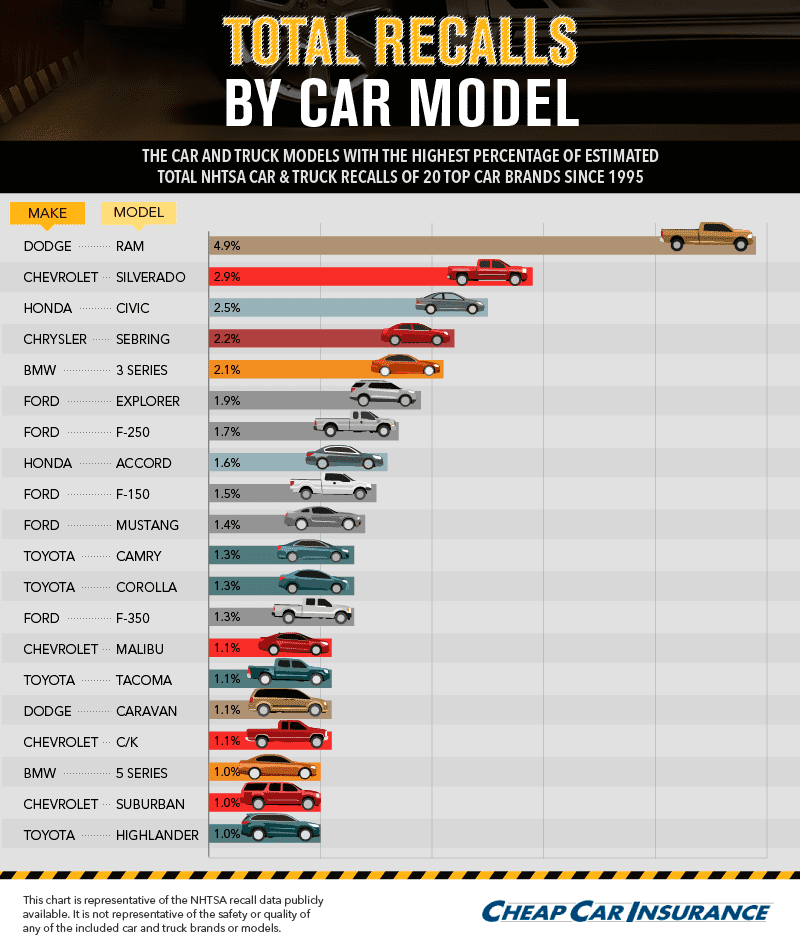
Next, we examined recalls based on specific models. When it comes to the dubious distinction of having the most associated recalls in the data set, one model is in the lead: the Dodge Ram (responsible for almost 5% of total recalls in the data). The Chevrolet Silverado, Honda Civic, Chrysler Sebring, and BMW 3 Series follow with 2% to 3% apiece.
Fueling the Ram’s top-spot status was Fiat Chrysler’s 2015 recall of almost 1.7 million recent-model Dodge Ram pickups to check or repair potentially faulty air bags, steering components, and wiring harnesses. The company also reportedly agreed to pay penalties due to its record of vehicle repairs during 23 past recalls.
Looking at the Most Defective Vehicle Components
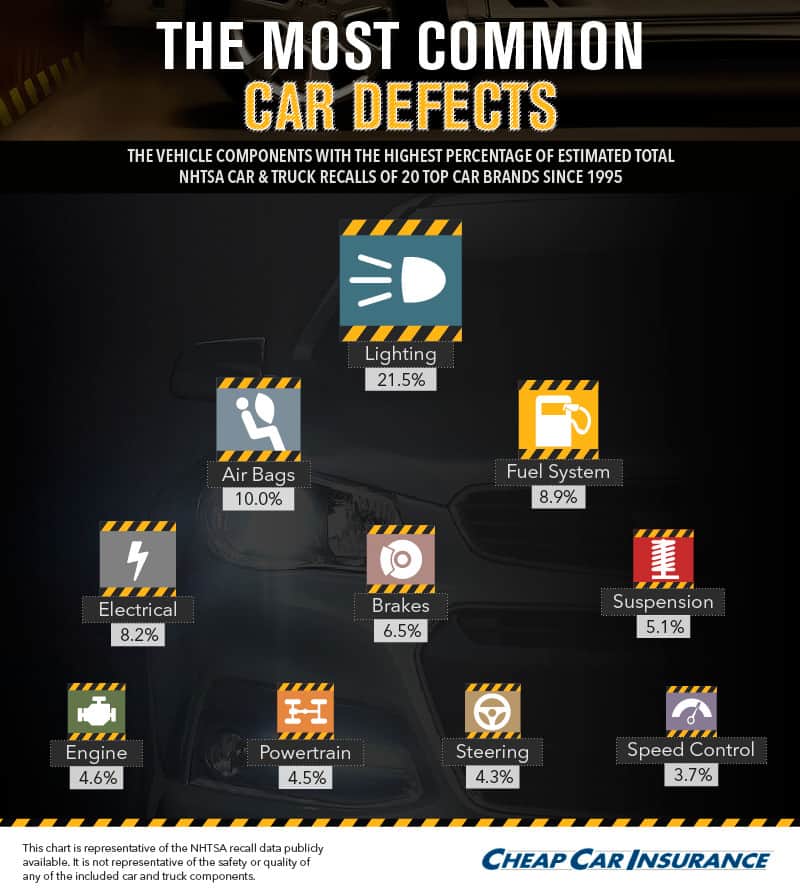
Automakers recall vehicles due to any number of reasons. But which components prompt the most recalls? According to the NHTSA data, faulty lighting is the most common reason for a recall, sparking more than 21% of recalls – more than twice as many as any other component. From failing headlights to flawed brake lights, malfunctioning lights can greatly increase danger on the road.
Three components vie for second place after lighting issues: Malfunctioning air bags prompt 10.0% or recalls, faulty fuel systems comprise 8.9%, and electrical issues spark 8.2%, according to the data set. In December 2015, Ford recalled vehicles due to potentially leaky fuel systems, and air bags have continually made headlines over the years due to issues with air bags supplied by Japanese company, Takata. Currently, these air bag recalls affect more than 19 million cars and trucks.
What Is the Most Recalled Model for Each Car Brand?
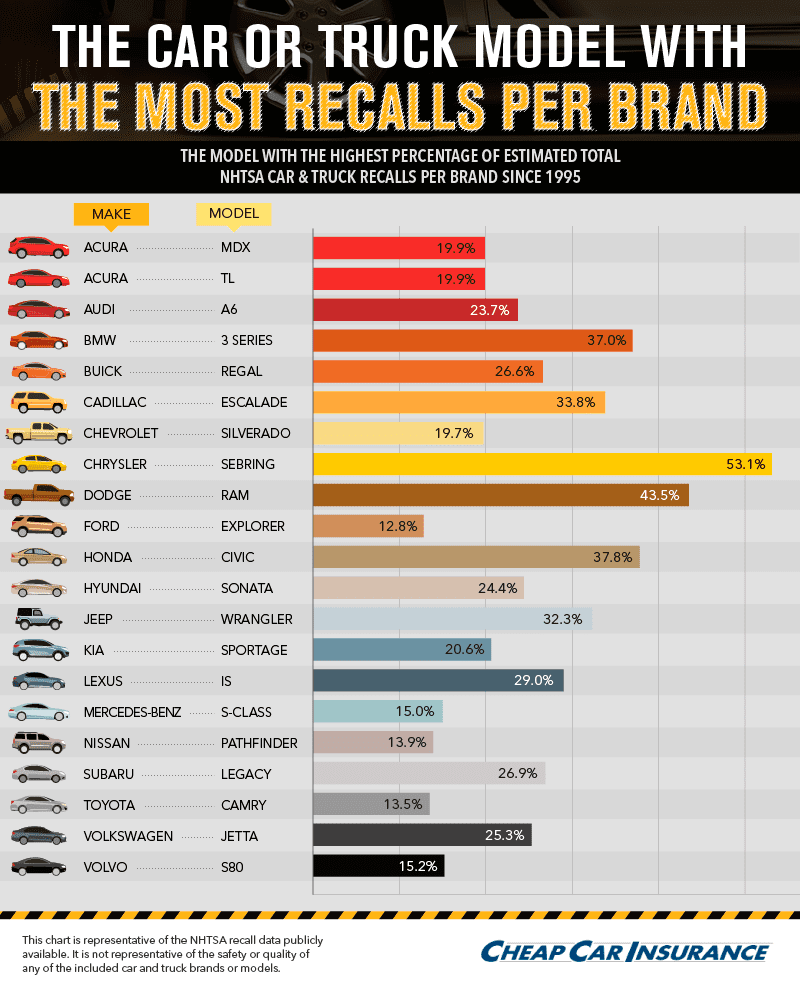
For many of us, considering an automaker’s specific models brings to mind a favorite – perhaps the flashiest or the most reliable. But every brand has another standout: the model most frequently recalled from among the cars they sell or have sold (according to the data). The most startling stat? 53.1% of Chrysler’s recalls in the data set are due to the Sebring, and nearly 38% of Honda’s recalls were due to the Civic.
Other models that made up the lion’s share of a car brand’s recalls include the Ram (43.5% of Dodge’s recalls), the 3 Series (37.0% of BMW’s recalls), and the Escalade (33.8% of Cadillac’s recalls).
Do Recalls Affect Annual Sales?
via CheapCarInsurance.net
In the flipbook above, you can see how each manufacturer’s number of recalls corresponds with its annual sales. Some charts display clear correlations: For instance, Toyota’s sales steadily rose as its recall frequency declined. Other manufacturers’ stats appear to show little correlation.
Although it stands to reason that recalls would affect sales, many experts say that’s not the case. Some believe that the high frequency of recalls overall has rendered car shoppers numb to them. Others say that consumers don’t necessarily consider recalls a reflection of a vehicle’s quality, but rather as a specific issue. These attitudes add up to good news for automakers who want to still count on sales regardless of recall numbers.
Which Type of Recall Is Most Likely for Each Brand?
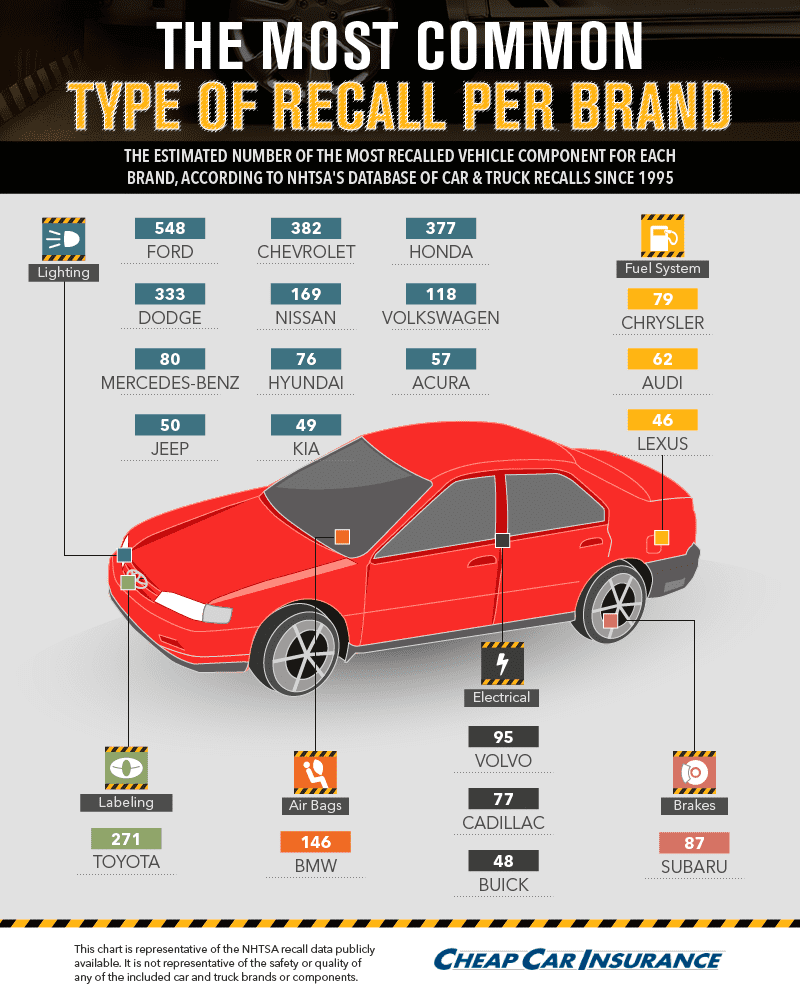
Categorizing the most common car defects for each brand reveals some interesting results. Lighting was the most frequent issue for 11 automakers, while faulty fuel systems and electrical flaws were most common for three brands apiece. Brake, air bag, and labeling recalls topped the list for just one brand each: Subaru, BMW, and Toyota respectively, according to the data set.
Looking Closely at Each Brand’s Recalls

Finally, we looked at a breakdown of each brand’s component recalls. Lighting was the most common type of recalls nearly across the board. 27.7% of Ford’s recalls were for lighting, which is more than any other component, according to the data. In December 2015, the manufacturer recalled over 313,000 cars due to headlight failures.
Many brands had a high amount of air bag recalls. Incidents such as a 2015 recall of some Toyota models due to problems with side curtain air bags and the infamous Takata air bag recall affected many of the car brands.
Conclusion:
Automobile recalls are a serious matter that affects virtually every driver on the road. The NHTSA, in its new public awareness campaign, “Safe Cars Save Lives,” urges consumers to check for open recalls at least twice a year and states that checking for a recall could help save a life. If there is a safety recall, the NHTSA advises owners to have their vehicles repaired as soon as parts are available. By taking these steps, this helps make the roads safer for everyone.
Methodology:
We chose 20 top car and truck brands and scraped the NHTSA database for recalls of defects since 1995. We then eliminated any recalls for commercial vehicles (semi-trucks, buses, transport vans, etc.) and motorcycles to get our final estimate of recalls. We then segmented the data by automotive brands, models, and components to determine which categories had the most recalls. For the sales figures, we used the corporations’ yearly U.S. sales by volume stats from GoodCarBadCar. We estimated the number of models for each brand since 1995 using CarQuery API.
Disclaimer:
This analysis should not be interpreted as an indication of what CheapCarInsurance.net thinks of any particular manufacturer, brand, or model or as an effort to disparage or endorse any particular manufacturer, brand, or model. The specific calculations used in our analysis were based on data compiled by, or reported to, the NHTSA, a U.S. Governmental Agency, CarQuery API and Goodcarbadcar.net. Such third party published data has not been independently verified by CheapCarInsurance.net.
Fair Use:
If you’re a journalist interested in covering this project, we encourage you to use any of the graphics included above. We just ask that you attribute CheapCarInsurance.net fairly in your coverage and provide a link to this page so that your audience can learn more about our work.
Sources:
http://www-odi.nhtsa.dot.gov/owners/SearchSafetyIssues
http://www.goodcarbadcar.net/p/sales-stats.html
http://www.carqueryapi.com/demo/dependant-selects-and-car-data-display/
http://www.freep.com/story/money/cars/chrysler/2015/09/10/fiat-chrysler-recalls-nearly-17-million-ram-pickups/71996330/
http://www.safercar.gov/
http://www.businessinsider.com/r-ford-recalls-313000-cars-for-lighting-failures-2015-12
http://wtkr.com/2014/05/15/gm-recalls-millions-more-cars-over-brake-light-problem/
http://sanfrancisco.cbslocal.com/2015/12/26/ferrari-ford-issue-recalls-due-to-fuel-leaks-fire-risk/
http://www.usatoday.com/story/money/cars/2016/01/12/regulator-lot-more-cars-could-face-takata-air-bag-recalls/78701892/
https://www.cars.com/articles/2013/02/do-recalls-affect-sales/
http://corporatenews.pressroom.toyota.com/releases/toyota+takata+recall+june16.htm
http://blog.caranddriver.com/toyota-adds-1-37-million-cars-trucks-and-suvs-to-takata-airbag-recall
http://finance.yahoo.com/news/ford-recalls-313-000-cars-155028135.html?soc_src=mediacontentstory&soc_trk=tw
http://www.consumerreports.org/cro/news/2014/10/everything-you-need-to-know-about-the-takata-air-bag-recall/index.htm
http://www-odi.nhtsa.dot.gov/recalls/recallprocess.cfm
By Aaron Crowe

Police officer writing a traffic citation while an unfortunate driver looks on from his car.
Driving recklessly can be expensive. A driving record with speeding violations, unresolved fix-it tickets or a drunk driving conviction can be costly not only for the court fees, but can drive up your auto insurance rates and make getting insurance difficult.
There are ways to get around that. Clearing your driving record after such mistakes can keep your insurance rates down by making it look like you never had the problems in the first place, giving you the same insurance rates as someone without a spotty driving record.
Ways to clear your record include contesting tickets, taking a driver safety course and asking that the violation be expunged, among others that we’ll detail later.
“It can be life changing, if you have three to five speeding tickets,” says Troy Thompson, a broker at Pinnacle Insurance Agency of Minnesota. “It can make getting insurance very difficult.”
Algorithms that insurance companies use to determine how many driving infractions cause insurance rates to increase differ among companies, Thompson says. Having a clean driving record for five years is preferable, he says, because that’s how far back many insurers check driving records. Some only look back three years.
Violations can stick around for years
Most simple traffic violations stay on your record for around three years, though it can vary by state and type of violation, says John Bowman, communications director for the National Motorists Association, a driver advocacy group. Serious violations such as a DUI, or driving under the influence, can stay on for 10 years or longer.
In Florida, traffic violations can “age off” and come off a driving record in three to five years, depending on the type of ticket and if there are no other violations during that time, says Jordan Ostroff, a criminal defense attorney in Florida.
“The minute they get convicted of a traffic offense, even on a first one, their insurance rates will go up a little bit,” Ostroff says.
One speeding ticket for 5 mph over the limit may not drive up insurance rates, or may only drive them up a small amount, but driving 20 mph over the speed limit or getting multiple tickets could cause your rates to go up 30 percent or more.
Start by fighting tickets
Fighting every ticket is the first place to start so that you don’t have to try to clear your driving record after the fact.
“The only way to really resolve a traffic ticket is to contest it in court,” Bowman says. “If you simply pay the fine, you have admitted guilt, which means the ticket will go on your driving record and could increase your insurance rates. Accumulate enough tickets over a given period of time and you could lose your license.”
The NMA encourages drivers to contest every ticket they get. “This helps keep the traffic justice system honest and gives people a fair shot,” Bowman says.
“If the officer doesn’t show up to testify, the defendant should ask for a dismissal of the case, which will likely be granted,” he says. “That’s about as good as it gets.”
Thompson, the insurance agent, says he’d rather go to court and contest every speeding ticket, and even pay the fee and fine if he can keep it off his driving record. Judges and prosecutors may be more likely to allow a driver with one or fewer tickets already on their record to keep a ticket off if they pay a fine and agree not to have any more violations for the next year, Thompson says.
“It’s smart to do what you can to have a clean record, but it’s also smart to fight it and keep it off,” he says of contesting tickets.
In the long run, paying a lawyer to contest a ticket and get it dismissed can be less expensive than higher auto insurance rates, Ostroff says.
“You’re always going to pay less if you pay the ticket immediately, but you’re going to get the fine and you’re going to get the points,” he says.
Even if you know you were driving too fast, there can be ways to get a speeding ticket dismissed — but you have to start by fighting the ticket in court, Ostroff says.
A judge can dismiss a ticket because the officer doesn’t show up in court, something is wrong on the ticket, or the radar isn’t calibrated, among others, he says.
Ask for expungement
You could wait for penalty points to come off your record in three to five years when they expire. Or you can ask a court to expunge the violation from your record, provided you haven’t had any moving violations since then or had your license suspended.
Californians can apply for a “dismissal” of charges with a two-page form and up to $150 in fees, and it can take a few weeks to a few months to get approved, says Christopher McCann, a criminal defense attorney and DUI lawyer in Southern California.
Only misdemeanors and felonies can be dismissed from someone’s court record, McCann says. Infractions aren’t criminal convictions and “there really isn’t a record that can be cleared with respect to infractions,” he says.
Any criminal conviction for which probation was successfully completed without violation will get approved for dismissal under California law, McCann says, with a few exceptions. Those include hit and run, DUI, DUI with injury, driving on a suspended license, reckless driving, evading, and speed contest.
They could be removed by proving “good cause,” he says. That can include not being able to get hired in your job search because you have a criminal record, or applying for admission to a school. It’s up to the judge’s discretion.
In Texas, a speeding ticket can still remain on your DMV record even if you were never convicted of the charge, says Paul Saputo, a criminal defense lawyer in Dallas. To get it expunged, a “deferred adjudication” petition must be filed with a court.
If a plea deal is reached on the charge, for example, and the defendant completes the terms of the deal and receives a deferred adjudication, then it isn’t on their driving record, Saputo says.
But without the expungement, even without a conviction, the ticket could still be on their record and auto insurance companies could find it and hold it against them by charging them higher rates. Some insurers may check for arrests and not convictions, he says.
“Take as much out of that public record as you can and you’re going to be better off,” Saputo says.
Take a safety course
Most states allow drivers to take a driver safety course to erase penalty points or dismiss tickets, depending on the violation. These are usually for minor offenses, such as moderate speeding, and not for criminal moving violations like a DUI.
Florida allows drivers to go to driving school up to five times in their lifetime to have tickets knocked off, Ostroff says.
DUIs tougher to remove
Most insurers will drop you if you have a DUI conviction, Thompson says. Getting one removed from your criminal record can be difficult, if not impossible.
Ostroff, the Florida attorney, says he’s never seen a DUI be removed from someone’s record. But Florida law allows a DUI to be charged as reckless driving with alcohol as a factor — also called a “wet reckless” — which allows the case to be sealed and expunged from a record 10 years later. Such defendants may have to pay higher fines or do extra community service to get this option, he says.
A DUI arrest will inevitably lead to a suspended license, says Saputo, the Dallas attorney, though your insurer may not learn about it immediately. They may not check your driving record until the policy renewal time arrives, leaving you with insurance coverage until then.
Saputo’s advice to people arrested for driving drunk is to not admit anything, because a DUI conviction can lead to all kinds of problems, including financial ones.
“People have a tendency to plead guilty to DUIs without knowing if they’ve done anything illegal,” he says, such as if they have a blood-alcohol limit of .08 percent — the level many states set as legally drunk.
“If you want to increase your insurance rates a lot, plead guilty to a DWI,” Saputo says of a driving while intoxicated charge.
Minor violations
“Fix-it” tickets for a broken taillight and other fixable problems should be addressed quickly. If you get to many of these types of tickets, they could be a red flag to your insurer when they check your driving record that you’re not a responsible driver.
Violations such as parking tickets are non-moving violations and have no impact on your driving record or insurance rates.
The best solution, of course, is to be a safe driver and maintain a clean driving record. That may not be easy, but it beats going to traffic school on a Saturday, hiring a lawyer or using any of these other methods to clear past mistakes from your driving record.
While on a vacation or passing through, a bad driver from another state is involved in a car accident – it may sound like the start of a joke, but the facts behind it are no laughing matter. Out-of-state motorists are in numerous deadly accidents every year, each sparking untold devastation and loss for all involved.
To find out more about which states’ licensed drivers are involved in accidents resulting in fatalities, we culled data from the National Highway Traffic Safety Administration’s Fatality Analysis Reporting System (FARS). Which drivers are the most accident-prone in the country? Which out-of-town motorists are involved in the most fatalities in your state? And how do drivers from your state stack up to those in the rest of the country when it comes to fatalities? We steer you through the stats below.
Mapping Accident-Prone Drivers
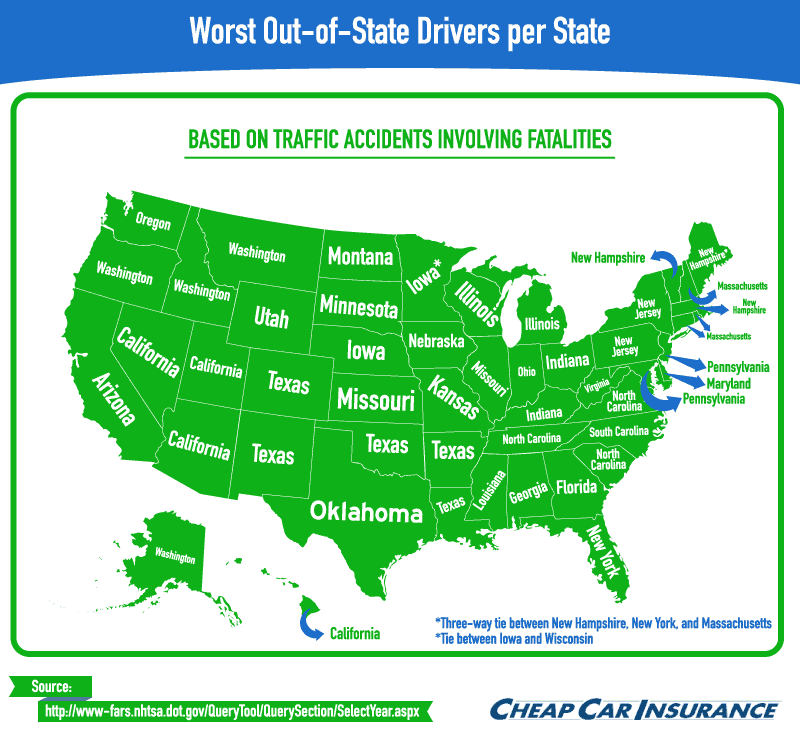
A glance at the map of accident-prone drivers based on number of fatalities reveals some interesting trends. Some states’ statistics are predictable – after all, most people naturally drive more often in neighboring states rather than faraway ones – but several surprises stand out. Among out-of-state drivers, Texans top the list for involvement in deadly crashes in a whopping five states. Washington state residents are most accident-prone in all their neighboring states, as are drivers from New Hampshire.
But proximity isn’t everything: New Yorkers are involved in more deadly crashes (based on number of fatalities) than any other out-of-state drivers all the way down in Florida. Texans are involved in tragic accidents in all four neighboring states, along with topping the list in Colorado. Illinois drivers are the most accident-prone visitors in three states, including non-neighbor Michigan.
Worst Drivers by State
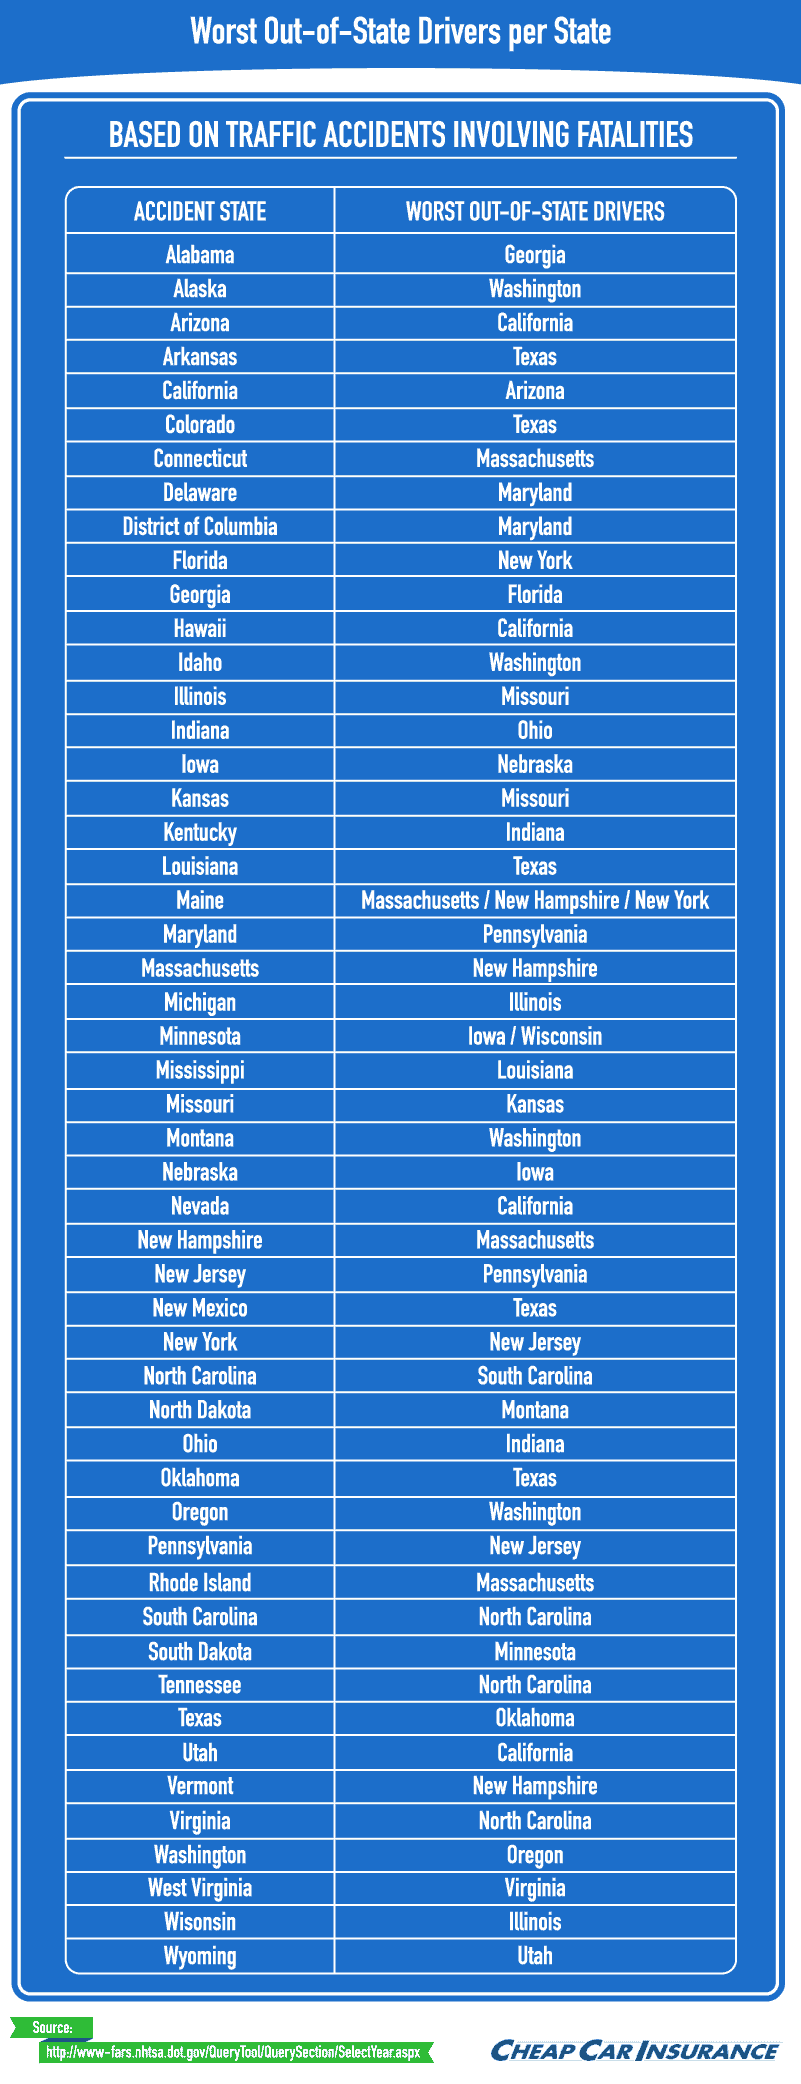
The graphic above offers a comprehensive look at which out-of-state drivers are involved in the highest number of fatal accidents in each state. Check the chart to see who the riskiest drivers are in your state.
Various factors contribute to fatal accidents –lighting conditions, road types and designs, drug or alcohol use, and distracted driving are all prevalent. In fact, it’s now estimated that a quarter of crashes, including non-fatal ones, involve cell phone use. But driving in a different state can add an additional layer of risk thanks to less familiar terrain, weather, and even certain road features, such as roundabouts.
Also, out-of-state drivers may be more prone to speeding or other infractions knowing that punishments are more difficult to enforce – after all, the threat of license suspension disappears for motorists who don’t hold that state’s license. In Georgia, for instance, around three-quarters of unpaid revenue from “Super Speeder” (extremely high speed) infractions is due from out-of-state motorists.
Accident-Prone Drivers Ahead
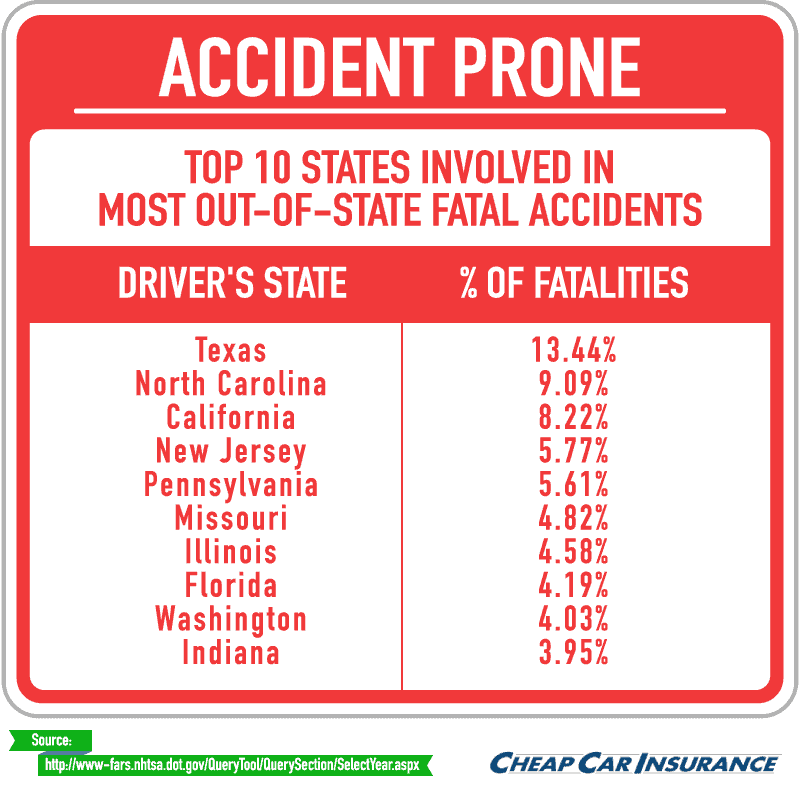
Accident-prone drivers reside from coast to coast, but motorists from the Lone Star State seem to crash more than their fair share: More than 13 percent of auto accident deaths across the country occur in crashes involving Texans. Though Texas’s large population is surely a factor, one recent study revealed that three-quarters of Texas drivers admit they sometimes talk on their cells while driving, while almost half admit they read or text while driving.
Though on opposite coasts, North Carolina and California motorists are involved in accidents in which 9 and 8 percent of accident fatalities occur, respectively. Of the Northeastern states, Pennsylvania and New Jersey drivers appear most likely to get in deadly crashes. And Missouri, Illinois, and Indiana represent a swath of accident-prone drivers across the Midwest.
Which region is home to drivers who are least often involved in crashes? Excluding California and Washington, no state in the West makes the top 10 for accident-prone states. Southeastern drivers also appear less likely to crash, save for North Carolina and Texas.
Who’s the Worst Driver In Your State?
See where your state ranks by clicking the interactive graphic to reveal the percentage of fatalities each state’s motorists cause in every state. To the right of the graphic, you can see what percentage of out-of-state fatalities drivers from each state are involved in. The most surprising takeaways? In D.C., Maryland drivers are involved in more than 45 percent of fatalities from crashes; Massachusetts motorists are involved in more than 12 percent in Rhode Island; and Montana drivers are in more than 10 percent of deadly accidents in North Dakota.
In Texas – where residents get in the most deadly crashes in other states – no visiting state made up more than 1 percent of fatalities caused by crashes: Drivers from Oklahoma, California, and New Mexico were involved in 3/4 percent of fatalities apiece. California was similar: The top three deadly crash–prone states (Arizona, Nevada, and Oregon) comprised less than 2 percent of fatalities combined.
Conclusion
Driving in a different state can pose a unique challenge – whether you’re white-knuckling through an unfamiliar city or trying to avoid lead-foot syndrome on a desolate highway stretching across a seemingly endless state. The information above reveals a startling snapshot of which states’ drivers are involved in a disproportionate number of deadly crashes. So how can Americans stay safe on the roads? Certain factors could help reduce risk, from enhanced driver education to safety campaigns conducted by law enforcement. On a personal level, you can reduce your crash risk by ensuring you don’t drink and drive, don’t drive distracted, and don’t speed – whether you’re sticking close to home or navigating an unfamiliar state.
Methodology
FARS classifies a deadly crash as any incident in which a vehicle’s motion causes a fatality. The database offers data on the drivers involved in the accidents as well as the locations of the fatal accidents. We collected information for 44,574 accidents that occurred in 2013 and analyzed the reported accident state and license state of the drivers. We excluded instances in which accident state and driver state were the same.
Sources
http://www.rita.dot.gov/bts/sites/rita.dot.gov.bts/files/subject_areas/safety/vehicle_fatality
http://www.nsc.org/NewsDocuments/2014-Press-Release-Archive/3-25-2014-Injury-Facts-release.pdf
http://archive.burlingtonfreepress.com/article/20130401/NEWS02/304010004/UVM-study-visitors-are-more-likely-than-Vermonters-to-be-at-fault-for-car-crashes
http://www.myajc.com/news/news/state-regional-govt-politics/out-of-state-super-speeders-ignore-georgias-limits/npKh2/
http://www.texastribune.org/2014/04/21/study-most-texans-drive-and-talk-many-text/
http://www.sciencedirect.com/science/article/pii/S0386111211000021
http://www.wkyt.com/wymt/home/headlines/Police-start-new-campaign-to-prevent-deadly-car-crashes-282327631.html
http://www.consumerreports.org/cro/news/2015/04/6-ways-to-avoid-a-car-accident/index.htm
http://www-fars.nhtsa.dot.gov/QueryTool/querysection/selectyear.aspx
Fair Use
Feel free to reuse any of the assets found in this project. When doing so, we ask that you please link back to Cheap Car Insurance and this page to give your readers a chance to explore our full report and the data behind it.
By Aaron Crowe
 If you’re on a tight budget and want to drive legally by having auto insurance that covers you in an accident, choosing a high deductible can save you some money in the long run.
Changing from a $500 deductible to a $1,000 one will save 5-10 percent on the premium, says Ryan Scruggs, a Farmers Insurance agent near Phoenix. “It’s not as big as people think,” Sruggs says of the approximate $15 monthly savings for the average consumer.
“It’s not a huge shift unless you have three or four cars on a policy and you bring them all up to a $1,000 deductible,” he says.
Still, it’s money that can be better saved or spent elsewhere, or at least saved to pay the deductible. Saving about $100 over six months of insurance premium payments can be the difference between paying another household bill or not for people trying to save every dollar they can.
A higher deductible cannot only lead to lower insurance premiums, but to fewer claims filed to keep them low.
But there are some things to consider before making such a decision, say insurance and financial experts. Here are some of them:
Do you have $1,000 in the bank?
It would be wise to have the higher deductible amount in a liquidity fund such as a savings account to cover you if you have an accident and have to pay a deductible — which is a specified amount of money an insured person must pay before an insurance company will pay a claim — say the financial experts we talked to .
Deductible amounts are typically in increments set by each state’s insurance department, often set at $100, $250, $500, and $1,000. The higher the deductible, the lower the insurance premium because the insured is taking on more of the risk.
With a low deductible, you’re paying an insurance company more through a premium to protect you in an emergency, which may not be the best use of your money, Hoyt says.
“Is the insurer my best financing option” to cover an emergency?” he asks.
Shanda Sullivan, a certified financial planner, cautions against raising a deductible if you can’t afford to pay it after an accident. At least six months of expenses should be set aside in an emergency fund, Sullivan recommends.
If you do not have a savings account established, start with a $250 deductible, Sullivan says. Once you have at least $1,000 in savings, raise the deductible to $500; at a $3,000 balance, raise the deductible to $1,000, she says.
“It takes a while to build that fund up, so keep your deductible low to avoid reaching for your credit card,” she says.
Charging your deductible?
Drivers who haven’t saved the deductible amount in a savings account and can’t afford to pay it when and if they get into an accident can charge it on a credit card.
“That’s an expensive source of financing,” says Robert Hoyt, a University of Georgia professor who heads the Risk Management and Insurance Program there. That move could work for 30 to 60 days, provided you pay it off as quickly as you can, Hoyt says.
Who really owns your car?
If you’re still making loan payments on your car, then technically the bank owns it and it may not allow you to drop collision coverage. Some lien holders may not allow a borrower to get a high deductible on their vehicle, says Chris Hardy, a certified financial planner in Georgia.
“Always be sure to check with the company that has a loan against the vehicle to make sure it is OK,” Hardy says.
Know your car’s value
A car’s age is a major factor in deciding what type of auto insurance to have and if filing an insurance claim is worthwhile. A car’s value can be looked up on Kelley Blue Book or elsewhere, and generally, car’s drop in value as they age.
Scruggs, the insurance agent, says if a vehicle is 8-10 years old, he recommends checking its value to decide if full coverage is needed. If the car is worth less than the deductible, then having a high deductible makes sense and the owner shouldn’t have full coverage.
“Is my vehicle worth the $1,000 deductible I’m willing to pay for it?” Scruggs asks.
Know the insurance coverage you need
For an older car, dropping collision coverage — which pays to fix or replace your car if it’s damaged or destroyed in an accident — can make sense if the car is worth less than the deductible.
Collision is one area where increasing the deductible makes sense, Hoyt says. Going from $250 to $1,000 can save 20-40 percent on insurance, he says.
“Generally speaking, collision is usually going to be the higher premium component of most people’s insurance policy,” Hoyt says.
Comprehensive coverage — insurance that pays for damage to your car that aren’t caused by a collision, such as fire and theft — should be kept, Hoyt says. However, there isn’t much savings to increasing the deductible for comprehensive coverage, he says.
A low collision deductible and a high comprehensive deductible can lead to some savings, says Maria Townsend, an insurance benefits specialist in Greensboro, N.C.
Liability insurance, which covers damages to another person if you cause an accident, is also worth keeping, Scruggs says.
“I never want anyone to lower their liability at any point,” he says.
Likely to get into accident?
Another consideration is where you live and what type of driving you do, says Townsend, the insurance specialist.
“When finances are tight and you honestly cannot afford a high premium for your auto insurance, you want to make sure you evaluate your everyday life when it comes to driving,” she says.
For example, living in an area with a lot of trees or deer that could hit your car may be worth having a high deductible for collision and a low one for comprehensive, Townsend says.
“That way if anything hits your car you won’t have any issue of trying to afford or pay of $1,000 worth of debt to the insurance company to fix your vehicle,” she says.
People who live or work on a busy street, or commute a lot, have a high chance of getting into an accident and may want a low collision deductible, she says.
When to file a claim
Once you determine the value of your car and get the insurance coverage you need, you’ll know when to file a claim if you get in an accident.
If your car is totaled, you should always file a claim. If it’s damaged and can be repaired, you’ll have to find out if the repair work costs more than the deductible. If the work does cost more than the deductible, then a claim is worthwhile.
One of the worst things to happen, Hoyt says, is to have a $500 collision deductible and an $850 insurance claim. That can leave you unsure if you should make a claim. The low deductible may be giving you a lower premium, which could go up if you file a claim.
Insurance rates won’t increase on your current policy if you file a claim, but they could go up next year at rate renewal time, Hoyt says. Not all insurers raise rates based on claims filed for accidents that weren’t your fault, but past accidents are a strong predictor of future accidents, he says.
Realize what insurance is for
A high deductible often makes sense because it allows you to be covered in a catastrophe, which is the main purpose of insurance.
“Insurance is not meant to be an investment with a return,” says Jeffrey Christakos, a certified financial planner in New Jersey. “It is designed to reduce the financial damage associated with a catastrophic event. It is a safety net.”
Car insurance can cover damages to a car, including total replacement, and injury to participants that includes a range of potential exposures, Christakos says.
“The deductible makes the coverage more affordable,” he says. “The larger the deductible the larger the safety net for most people.”
Filing a claim after every little accident doesn’t make sense, Hoyt says, and isn’t why people should have insurance.
“Insurance is doing its work, whether you have an accident or not,” he says.
People tend to buy relatively low coverage limits with low deductibles so that they’re covered for the minimum required by law without having to pay much money out of their pocket in an emergency, Hoyt says.
They default to a low deductible because “having this stuff (insurance) is only good if I can use it,” he says. The better choice is to use your money elsewhere by having a higher insurance deductible, he says.
By Aaron Crowe
 Excluding the purchase price, owning and operating a car costs $8,698 in 2015, according to AAA.
That’s a lot of cash to put out for something you’re likely to get rid of in 10 years or so and replace with another car. Operating a vehicle is the second-highest expense in U.S. households, behind housing and just ahead of food costs, according to the U.S. Bureau of Labor Statistics.
The expenses of owning a car fell 2 percent in 2015, due to drops in gas prices and finance charges, AAA found in its study. The $8,698 figure is for a typical sedan driven 15,000 miles annually, working out to 58 cents for each mile driven, or nearly $725 per month.
Most of the costs of a car are expected — such as gas and maintenance — but others such as finance charges, insurance and depreciation may not be given much thought by consumers. Here’s a breakdown of the costs of driving a car:
Depreciation: This was the biggest cost of owning a car, at 42 percent of AAA’s total, or $3,654 per year. New cars can lose around 10 percent of their value the minute their driven off the car dealer’s lot, and around 20 percent total loss a year later.
Cars are meant to be driven, which makes them more likely to break and lose their value, says Akshay Anand, a senior analyst at Kelley Blue Book.
Owning a car that’s only a few years old can mean you’re already behind on the technology of newer cars, says Kyle Baskin, owner of Top Shelf Lifestyle, a luxury car rental company in Los Angeles.
“Cars are like phones,” Baskin says. “They keep coming out with new models and people don’t want them anymore.”
Fuel: Gas accounted for 19.3 percent of the annual cost of running a car, or 19.3 percent.
Better fuel economy and cheaper gas prices helped make the cost of owning and operating a sport utility vehicle slightly cheaper than that of a large sedan this year, according to AAA.
Low gas prices can help sell vehicles that don’t get good gas mileage, but consumers should still look for high MPG (miles per gallon) vehicles if they want to save money in the long run, Anand says.
“In the back of your mind you want a car that has good mpg, because you don’t know where gas prices will be in five years,” he says.
Insurance: At $1,115 per year, or 12.8 percent of the annual cost of owning a car, insurance is the third highest cost.
While rates vary by driver and geographical area, consumers should consider the type of car they’re buying when comparing insurance rates. A car with low mpg that’s packed with extras such as an infotainment system, advanced safety features and is made of lightweight materials can be more expensive to repair and insure.
Having your car totaled in an accident can lead to more expenses than insurance. If you can’t find a car for the amount of money your insurer is reimbursing you for the loss of your car, you may have to come up with more money on your own to afford the car you want. Setting money aside in an emergency fund each month would help make that expense easier.
Maintenance: At $766 per year, or 8.8 percent of the annual cost, maintenance can look a lot lower than most people think it is. It includes labor time and repair costs for factory-recommended maintenance, along with the average costs of an extended warranty.
Baskin, the luxury car rental business owner, says maintenance costs can skyrocket for high-end cars. A privacy curtain on a Mercedes Maybach that’s operated by motor and a remote control costs $10,000 to repair, he says.
“God forbid, the transmission goes out,” Baskin says of exotic cars that aren’t under warranty.
Not doing regular maintenance, such as oil changes and battery inspections, can lead to bigger problems later.
Finance charges: $669, or 7.7 percent of the annual cost. These costs dropped in 2015, down 21 percent as more manufacturers offered low finance rates to attract buyers.
However, buyers should be aware of finance charges or other dealer fees that aren’t spelled out in the contract or aren’t clear, Anand says.
“A lot of times, the money you pay down the road can be a lot more than you’re looking at,” he says.
License, taxes and registration: $665 or 7.7 percent of the annual cost. These expenses are set by state governments, so there isn’t much consumers can do to avoid them, other than shopping in another area with lower tax rates.
Tires: $147 or 1.7 percent of annual cost. Good tire maintenance is important, Anand says, and driving aggressively can cause the need for more frequent tire replacement.
“Everyone knows you have to replace your tires,” he says.
Tickets: While this isn’t a cost that AAA put into its figures, traffic violations for speeding, parking illegally and other infractions can add up for drivers who aren’t careful, Anand says.
Speeding in California, for example, can cause auto insurance rates to go up by as much as $538, according to Fixed.com, an app that helps drivers fight tickets.
By Aaron Crowe
 If you’ve ever taken three right turns around a block to get to your driving destination instead of turning left once, you know the dangerous feeling of a left-hand turn at an intersection.
Left-hand turns at intersections cause 60 percent of crashes, while right turns cause 4 percent, according to the National Highway Traffic Safety Administration, the federal agency in charge of road safety. Turn signal violations and insufficient gaps are the two main factors associated with the crashes, according to the NHTSA.
“It’s where the worst type of accident occurs,” says Robert Passmore, assistant vice president of personal lines policy at the Property Casualty Insurers Association of America.
While making left-hand turns illegal in all circumstances isn’t feasible, transportation engineers have worked to make left turns safer, and the delivery company UPS has its drivers make as few left turns as possible as a way to save gas, time and prevent accidents.
The traffic navigation app Waze is looking at changing its routing algorithm to avoid treacherous left turns known as the “Waze left.”
What makes left turns so dangerous?
Approximately 20 percent of accidents at signalized intersections involve a turning vehicle hitting a pedestrian, with left turns accounting for 60 percent of them, according to a Federal Highway Administration study.
Driving involves many skills — visual search, perception and judgement — and making a left turn in traffic only taxes those skills more. There are different left-turning signals for drivers to understand.
The FHA study focused on three:
- Permissive scheme, where the driver must let oncoming vehicles cross before turning left.
- Protected scheme, where a driver can turn left without oncoming vehicles disturbing the maneuver.
- Permissive/protected scheme, where a driver can turn left during a segment of the green light phase.
Protected signals were best understood by drivers, followed by permissive signals and the permissive/protected scheme.
How to make left turns safer
State transportation officials in Virginia found that simple, relatively inexpensive measures such as adding a protected turn signal to a left turn — allowing only left turns during a green turn light — dropped the average 8.7 crashes from left turns at intersections to zero, according to the Insurance Institute for Highway Safety.
Transportation planners in New York City found that left-hand turns were three times as likely to cause a deadly crash involving a pedestrian as right-hand turns. The city has made it a goal to reduce pedestrian deaths, and has re-engineered streets and intersections by restricting left-hand turns.
Since New York began restricting left turns more than a decade ago, pedestrian fatalities decreased 28 percent and serious injuries to pedestrians dropped 22 percent.
The best solution may be to simply require better driver training and more stringent requirements for getting a license, says Kristofer Kirchen of Advanced Insurance Managers in Tampa, Fla. While he hasn’t noticed a glut of left-turn incidents in his auto insurance business, Kirchen says they can be more severe given the dearth of side-impact protection and the disparity in vehicle sizes involved.
Traffic circles and roundabouts can make left turns easier, says PCIAA’s Passmore. “You actually might get a few more accidents, but they’re going to be slow speed” and less deadly, he says.
Right turns only
Betty Nicholas, a media services company owner and Chicago suburb driver who stopped driving a year ago when her eyesight worsened, says she has been in three left-hand turn accidents during the past 10 years while driving.
The latest was two years ago as she was turning left into her driveway. An oncoming driver motioned for Nicholas to turn, which she did and was hit by a car in the second oncoming lane that she didn’t see because it was blocked by the first driver.
“I was so shocked,” she says. “He said ‘Go,’ and I just went.”
Making left turns were a problem for Nicholas for years, partly, she thinks, because of her old age, loss of peripheral vision and turning too slow. Her solution was to make right turns around the block on busy streets.
Her solution is the same as one instituted by UPS, one of the largest shipping companies in the world, though her is less high-tech.
A year ago, the company had more drivers use its proprietary GPS system called Orion to help make its delivery drivers more efficient. In calculating the most efficient route, Orion almost never routes a left turn. Safety is one reason for using it, but also so drivers can avoid left turns where they may have to wait on a stoplight.
Author Peggy McAloon says she was rear-ended by six cars while she was trying to make a left-hand turn because “the car behind me didn’t notice the turn signal or my brake lights,” starting a chain-reaction plowing into her by a drunk driver with a revoked license. Her solution? Avoid left turns at all costs.
“I will go out of my way to avoid left-hand turns,” McAloon says. “The life-long injuries are incentive enough to take the extra time if there isn’t a signal at the corner where I need to take a left.”
By Aaron Crowe
 Thousands of cars damaged in the recent Texas and South Carolina floods could be finding their way into other states, with their damaged mechanical parts and electronics posing a risk for drivers, warns a Washington state licensing department.
The “flood cars” could get cheap or insufficient repairs and not look water-damaged from the outside. They could then be sold with the sellers or buyers being unaware of the vehicle’s true history, according to a warning from the Washington state licensing department.
While selling such a salvaged car isn’t illegal in Washington state, not disclosing its history is illegal. Flood cars must be marked as junk or salvage to warn future buyers of potential car problems, according to Kars4Kids.
In the three years since Hurricane Sandy hit the U.S., half of the 250,000 cars damaged by the hurricane will be resold, some in states that don’t require disclosure that they’re flood cars, according to a Kars4Kids graphic.
How salvage process starts
The process of determining if a water-damaged vehicle can be driven again is determined by insurance companies after a flood. They determine if a flooded car can be repaired or needs to be completely salvaged.
If a car is labeled as salvaged, it can still be sold if labeled as such on its title through the state DMV. If an insurer declares it a total loss, the salvaged vehicle will be auctioned to recyclers, who work with law enforcement and the National Insurance Crime Bureau, or NICB, to ensure they’re re-titled through their state with a “Salvage” title that shows the vehicle was flood damaged.
The cars then move down to recyclers, who take them apart and sell their salvageable parts.
Flood-damaged cars with a salvage title can still be sold. Some states require that flood damage be listed on the title, while others don’t. It’s up to the buyer to determine if they’re comfortable buying such a car with its checkered past.
Cars that aren’t listed as salvaged — but are still declared a total loss — can be repaired and sold in “good” condition.
Some salvaged cars from floods, however, bypass recyclers through unscrupulous sellers and the refurbished cars are sold to unsuspecting buyers who aren’t told about the car’s true history.
Some flood damage can’t be fixed
Cars aren’t built to be water tight, and even minor flooding can damage a car’s electronic systems that are often under seats or in other low points in vehicles. Mechanical problems may not happen immediately to a flooded car, with rust causing damage over time and axles falling apart from rust, for example.
“A lot of water-damaged cars are total losses,” says Robert Passmore, assistant vice president of personal lines policy at the Property Casualty Insurers Association of America.
A salvage title is the first tipoff that a low-priced may have been flooded and repaired. But not everything can be fixed on a water-damaged car.
“If a car is refurbished after a flood they can fix cosmetic items on the car but it is really hard to repair an engine that has water damage,” says Chrissy Nigro of Nigro Insurance Agency in Philadelphia.
How to spot flood-damaged vehicles
Along with using a reputable car dealer and staying away from cars that have extremely low prices that seem too good to be true, consumers can avoid being scammed with flood cars by doing a free NICB background check of the vehicle’s VIN, or vehicle identification number. Assuming the VIN hasn’t been changed, the check will show if the vehicle has ever been salvaged.
Buyers should also ask to see the title of a used car, checking the date and place of transfer to see if it came from a flood-damaged state and if it’s a “salvage’ title.
A car should also be inspected by a licensed mechanic, and buyers should look themselves for signs of water damage.
The Washington state Department of Licensing recommends the following checks for potential flood-damaged vehicles:
- Check gauges on the dashboard to ensure they’re accurate, and to look for signs of water.
- Test the lights, windshield wipers, turn signals, cigarette lighter, radio, heater and air conditioner several times to make sure they work.
- Flex some wires under the dash to see if they bend or crack, since wet wires become brittle upon drying and can crack or fail at any time.
- Check the trunk, glove compartment and beneath the seats and dash for signs of mud, rust or water damage.
- Look for discolored, faded or stained upholstery and carpeting.
- Check for a well-defined line, or watermark, on the car and for musty odors resulting from mildew.
Insurance for flooded cars
There are some insurance issues to be aware of after buying a flood-damaged car, and when making an insurance claim on a flooded car.
Generally, an insurance company will only offer limited coverage or none at all on a car that has been issued a salvage title, says Nigro, the insurance agent.
Insurers usually don’t need to pre-inspect a used car before insuring it, Passmore says. However, any damage to a car from previous owners, such as from a flood, won’t be covered by car insurance for the new owner, he says.
While homeowner’s insurance often doesn’t cover flooding, auto insurance does. For someone who has had their car damaged by a flood and wants to be reimbursed by their insurer for the loss, the comprehensive coverage in their auto insurance policy will cover flooding.
By Aaron Crowe
 Some things you may not realize you want delivered to your door until it happens: shaving razors, huge pears, toothpaste, medical marijuana and individualized packets of snacks, along with, of course, hot food.
A company based in Los Angeles — the home of the freeway — is betting that consumers will want something delivered to them that they may not have thought was worth the extra cost or would save them much time: gasoline. It’s one of a few gas delivery companies in the U.S.
“Few people really like to go to the gas station,” says Bruno Uzzan, co-founder of Purple, a start-up aiming at changing the gasoline industry.
For people who already drive a few miles out of their way to save 10 cents or less on a gallon of gas, Purple may be the money-saving app they didn’t realize they needed.
While many people are willing to deal with a 10-minute stop every week or so to fill up their gas tank, it’s still “one of the worst experiences” for many people who would rather save their time for something else and avoid the security problems of getting gas late at night, for example, Uzzan says.
“We are thinking about changing a habit that has been there forever,” he says.
How it works
Delivery is currently free, though $1 is charged for delivery in less than an hour. The company plans to charge a fee for all deliveries eventually, such as $5 to $7 for a rush job, he says. The normal delivery time is less than three hours. Uzzan says Purple, which started doing business in L.A. in May, didn’t start off charging a fee for a simple reason: to gain customers.
“For now we wanted to get the service as accessible as possible for people,” he says.
Its goal for prices for gas is to be below the average prices in each delivery area. In late October in L.A., Purple charged $2.99 a gallon for unleaded 87 octane gas, compared to an average cost of $3.10 to $3.20, Uzzan says.
Purple is currently offered in metro L.A. and San Diego, with the goal of expanding to San Francisco and Seattle by the end of the year, Uzzan says. It plans to start deliveries in 10 cities by April 2016, he says, including New York City, Boston and Washington, D.C.
Here’s an example of how the service works:
You’re low on gas and need 10 or 15 gallons of gas — which are the only increments Purple offers — so you use Purple’s mobile app to request that gas be delivered and deposited into your car in a three-hour timeframe between 7:30 a.m. and 10:30 p.m. Overnight deliveries are planned for the future.
Delivery can be to your home or office, and you don’t have to be at your vehicle when the courier arrives. You just need to leave your gas tank open. You don’t provide your keys to the delivery person, and there’s no need for them to drive your car.
They pour the gas in your tank from five-gallon gas containers they carry. Payment is made through the app.
Designed for the masses
Uzzan didn’t want to specify how many customers Purple has, but said it has a couple of thousand active members that buy regularly.
Luxury car owners in wealthy L.A. neighborhoods made up most of Purple’s early adopters. “A lot of folks driving a beautiful car don’t want to get their hands dirty,” Uzzan says.
More recently, the company is seeing more everyday cars using the service, he says.
Uzzan says he doesn’t expect Purple to kill gas stations. He points out that of the 40 million people who stop at a gas station daily, capturing 0.1 percent of them would equate to 40,000 daily users of the delivery service.
“There will always be people who want to stop at the gas station,” he says.
Gig economy expansion
Because California law restricts gas deliveries to 30 gallons before strict regulations take effect on how gas is transported, Purple’s delivery system relies on Uber drivers and other individuals to deliver its gas on demand.
They’re paid per delivery, and their pay is more than other on-demand industries, including Uber, says Uzzan, who didn’t want to specify the rate.
Other companies fill up gas tanks for customers too. Luxe offered a summer sale on its car cleaning services and offered to fill up customers’ tanks upon return of their vehicle.
Filld offers gas delivery in Silicon Valley between San Jose and Palo Alto for a $5 delivery fee. The gas costs whatever the average price of gas is in the customer’s area.
While gas delivery isn’t a common request at WeGoLook, a company that specializes in sending its agents to inspect autos and do document research, it is a service that it would provide if customers requested it, says Robin Smith, the company’s CEO.
Gas delivery would cost $25 to $30, though Smith says she expects most of the company’s customers to want its hired agents to take their car and fill it up for them instead of delivering gas.
“I don’t know how many people would want us to do that,” she says of filling up on the spot.
“I guess the thing with gas is, it doesn’t take that long,” Smith says. “There are lots of places to go get it.”
But at a time when even the smallest chore is done from a smartphone, gas delivery is one less chore in the lives of busy drivers, says Uzzan, the Purple co-founder.
“People are asking for things to be done in a very, very easy way,” he says.
It doesn’t get much easier than a phone app. You just have to be willing to pay about $5 for a task that would take you 10 minutes or less to do on your own.
By Aaron Crowe
 The number is staggering and often alarms parents of college students — 1,800 college students die every year from “alcohol-related causes.”
This often-repeated claim is frequently linked to binge drinking. But a closer look at the numbers finds that most of the deaths — three-quarters of them — are related to vehicle crashes as “alcohol-related injury deaths” where alcohol is cited as a factor.
A lot of college students aren’t just dying from binge drinking, but mostly from being involved in a car accident while drunk or when someone else is drunk. And those young adults may not necessarily be college students, according to a Washington Post review of the figures.
Where the numbers start
The number of “alcohol-related unintentional injury deaths” — 1,825 to be exact — comes from a third report on these deaths in 2005. The report was led by Ralph Hingson, director of the epidemiology and prevention research division of the National Institute on Alcohol Abuse and Alcoholism.
The first report listed the number of such deaths at 1,442 in 1998, growing to 1,647 in 2001.
A fourth report is expected to come out this year, which should show a decline in binge drinking and DUIs among college-age students, Hingson says.
The 1,825 figure of college, he says, comes from a conservative estimate that one-third of the 5,461 alcohol related deaths averaged annually from 2006-2010 for people ages 18-24 were in college.
Faulty figures?
The figure is from data from the Centers for Disease Control and Prevention. However, no deaths are directly linked to binge drinking in the calculation of the statistics, the Post reported.
One problem, according to the Post, is that the 1,800 figure is an estimate of the number of young adults who are college students. There isn’t data in the accident records about whether someone is a college student, so researchers estimated what they believed would be college students.
The increasing number of college students dying while under the influence of alcohol may simply be because more young adults are going to college: from 30 percent in 1998 to 33 percent in 2005.
Alcohol deaths in cars over-estimated?
About three-quarters of the 1,825 deaths are related to motor-vehicle crashes. The rest are from non-traffic deaths such as fires, falls, drownings and other “alcohol-related injury deaths.”
Even among the 1,825 alcohol-related deaths among college students, the data doesn’t always mean that alcohol consumption caused the crashes. The National Highway Traffic Safety Administration has said since at least 2003 that a vehicle crash is considered to be alcohol-related if at least one driver or non-occupant (such as a pedestrian or bicyclist) involved in the crash has any measurable amount of alcohol in them.
“The term ‘alcohol-related’ does not indicate that a crash or fatality was caused by the presence of alcohol,” the NHTSA wrote.
If a pedestrian was drunk and is hit by a sober driver, the fatality would be listed as “alcohol-related.” Even if alcohol didn’t cause the accident and death, anyone involved in the accident who is found to have drunk any amount of alcohol is enough evidence to list it as an alcohol-related crash.
Hingson, who wasn’t originally aware of the NHTSA warning about accident data, agrees that alcohol isn’t the only cause of these accidents.
“You can’t always say that alcohol always causes every traffic death,” Hingson says. Speeding, not wearing a seatbelt, red-light running and other transgressions could be factors, he says.
The number of college student deaths related to drinking could be under-reported, Hingson says, because his group of researchers didn’t include homicides and suicides, for example, that could be related to alcohol.
“These are estimates,” he says of the 1,825 figure.
Better reporting of alcohol deaths needed
There are a few things that could improve determining how many college students die from alcohol use, Hingson says. One is that college identifiers are needed in fatal crashes to determine if the person who died was a college student, he says.
Another is the variation among states on under-reporting alcohol involvement on death certificates. In another NIH report that Hingson was involved with, motor vehicle traffic crash fatalities where alcohol was involved was found to be under-reported.
Reasons that a physician, coroner or medical examiner might not have included alcohol as a fatal factor on a death certificate include avoiding distressing relatives or social stigma, and insufficient training in death certification.
The NHTSA reported in 2012 that alcohol-related motor vehicle deaths are underreported, and alcohol testing for surviving drivers is much lower. In a study of Blood Alcohol Concentration, or BAC, testing and reporting for drivers involved in fatal crashes from 1997 to 2009, the NHTSA found that in 2009 BACs were known for 71 percent of fatally injured drivers and only 27 percent of surviving drivers.
One reason for the low testing was that 22 states had no law requiring it and went with probable cause, while 25 states had laws requiring testing in all fatal crashes. The basic standard for a law enforcement officer to request BAC tests is that the officer has probable cause or reasonable grounds to believe the driver was breaking the state’s impaired driving law.
In 2009, states that required BAC testing by law had 13-15 percent higher testing rates than states requiring probable cause.
From 1999 to 2009, death certificates reported that alcohol was involved in 3.3 percent of traffic deaths. The federal Fatality Analysis of Reporting System, or FARS, which collects information on car accidents, reported alcohol was involved in more than 20 percent of fatal accidents.
To test as many drivers as possible, the NHTSA recommends requiring a law to test for all drivers in fatal crashes, and eliminating laws that require probable cause for a surviving driver to be tested.
Medical examiners and coroners should test all fatally injured drivers whenever possible, and law enforcement should test all surviving drivers, the report recommends.
Also, BACs from hospital records can be used my medical examiners and coroners for drivers who die after admission to hospitals. Blood test kits should also be provided as needed, and states should pay testing costs.
Reporting can be made simpler by establishing routine reporting, including electronic reporting forms, and tracking all fatalities to follow up on all missing BACs.
Gathering complete and correct statistics is probably the best way to get to the most accurate numbers and gain a better understanding of when alcohol kills college-age adults.
Until then, that 1,800 number that keeps getting thrown out as the best number for binge drinking deaths among college students may only scare them and their parents in one area and not when they get behind the wheel.
By Aaron Crowe
 Not finding your car parked where you remember parking it can leave you in a panic attack. Your first thought is that it was stolen. Your second thought, if you’ve considered the options for a minute or so, is that you’ve been towed.
Whether you parked in a no-parking zone and are taking a chance that your vehicle won’t be towed, or accidentally parked illegally, if your car has been towed, every minute counts. Or at least every hour does. That’s how often the tow yard operator can charge you an additional storage fee.
Getting your car back as quickly as possible is prudent financially, but also because you need your car more than you realized when you parked illegally. Here are some tips for getting it back as quickly as possible:
- Call the police
Calling the police immediately is probably your first inclination, but not for the reason you think. If your car is stolen, this is obviously a good first step.
Don’t call 911. That number is for emergency calls only, and your towed car is not an emergency. Call 411 and ask for the number of the local police department. Police can then tell you if your car has been towed or stolen.
Even if you think your car may have been towed, the police can be a good place to start because they can tell you how to contact the towing company and where to go to get your car back. Some cities require payment be made at the police station, along with proving ownership of the vehicle.
Instead of calling the police directly, your city may have a phone number for towed cars that goes directly to the tow lot or provides more information. The city may also have an online towing database to search for your car by its license plate number.
- Have your documents available
In addition to having your driver’s license on you, your car insurance and registration should be in the car or carried in your wallet or purse whenever you drive.
Proof of insurance and registration will be needed to get your car out of impound. If you have copies at home, bring those with you to the impound lot or police station, though the copies in your car should suffice. Many states accept electronic proof of insurance, too.
- Brace yourself for unpaid tickets
If you have any outstanding tickets that haven’t been paid, such as parking tickets, those will have to be paid first. Steven Paul, owner of Test Drive Technologies, a vehicle inspection company in St. Louis, MO., that checks impounded vehicles for damage, says tow companies run VIN numbers into their computer to check for unpaid tickets.
- Prepare to pay
If you don’t have unpaid parking tickets to take care of, you’ll still have to pay to get your car back. Unless you have a lot of cash with you or have a big checking account, you’ll need a credit card. Some cities, such as Boston, don’t accept personal checks, though money orders and cashier checks are OK. Some tow lots may only accept cash. Call ahead to find out what payment is allowed.
St. Louis charges $250 to get a car out of impound, Paul says. Most cities will post their towing fees online. Boston, for example, charges a $90 seizure fee and a storage fee of $3 an hour for up to $15 per day.
Storage fees may add up hourly or daily, so it can pay off to get your car back as fast as you can.
- Check operating hours
Don’t assume all impound lots are open 24 hours a day, seven days a week to get your car back, including on a Saturday night after you’ve visited a few bars.
If your car was towed from municipal property, it will probably be towed to the city impound lot — which may not be open weekends.
If your car was towed from private property, a private towing company will tow it to its lot, which is more likely to be open all of the time — though not necessarily holidays. Also, if your car was towed from private property, look for a sign on the property listing the contact information for the towing company.
- Be aware
Boston, which seems to offer plenty of online help for owners of towed cars, offers towed car alerts via voicemail, text and email. You just enter your phone number of email address on its online form, along with your license plate number, and you’ll get an automated alert usually within an hour of your vehicle being involuntarily towed.
The city also offers extensive information about parking permits and how to find out what day a street sweeper will come down your street so you won’t park and be towed on a street cleaning day.
- Be nice
When you do get to the tow yard, it can only help to be nice, says Ken Beckstead, a Palmdale, CA., resident who owns a cigarette receptacle company. Beckstead’s car was towed to a lot that had terrible online reviews, he says.
“I talked nice to them and they actually knocked a day off storage and helped me replace my stolen wheels while the car was still in their yard,” he says. This saved me hundreds of dollars just by being nice to them.”
“It’s stressful getting towed and all day people abuse the tow yard workers,” he says. “Break the cycle and be nice. Great things can happen.”
- Take pictures
Survey the scene of where your car was towed from and make sure you weren’t in the wrong, suggests Paul Moyer, who writes about saving money at SavingFreak.com. If you think your car was towed illegally, take all of the photos you need to show where your car was and the signs in place, Moyer says.
If the tow was illegal, you can ask for a hearing and present your case, he says.
- Check for damage
If your car was damaged during towing, take photos of the damage at the tow lot, recommends Paul, the vehicle inspector in St. Louis.
While damage isn’t common, it can happen, says Paul, who looks under towed cars to see if the tow hook bent something, such as suspension components. Look for new tow marks on the paint, not pre-existing damage, he says.
- Get there with 72 hours
If you don’t get your vehicle out of the impound lot within 72 hours, some cities will start the auction process 72 hours after towing and cars can be sold in 10 days. New York City does this, beginning the auction process three days after a tow.
If escalating fees aren’t enough to get you to move quickly in getting a towed car back, the chance of seeing your car legally driven by someone who bought it at auction a week or so later should be enough incentive to get moving.
By Aaron Crowe
Photo Courtesy of VolkerWessels
The advantages of plastic roads almost sound like a utopian view of the future, if not Disney World’s Epcot Center: Virtually maintenance free, made entirely of recycled material, and no potholes.
Epcot, the Disney theme park where the future is forecast, doesn’t have roads made of recycled plastic, but a city in the Netherlands soon will. “Soon,” as in within two years in a pilot project in Rotterdam by the Dutch firms VolkerWessels.
Called “PlasticRoad” by its makers, the lightweight design offers numerous advantages compared to conventional roads such as asphalt and concrete:
- Recycling more plastic. The idea is to make PlasticRoad from plastic that usually gets incinerated. At the end of its lifespan, PlasticRoad is expected to be able to be recycled again for a new PlasticRoad.
- Recycled bottles and other plastics are used to make the prefabricated road parts that can be installed in one piece, making construction of PlasticRoad easier and installation simpler.
- Virtually maintenance free. Corrosion and weather doesn’t affect it, according to VolkerWessels. The road can withstand temperatures from below 40 degrees Fahrenheit to 176 degrees. It’s also much more resistant to chemical corrosion.
- Longer lifespan. Predicted lifespan of the roads will be tripled, according to the company. That leads to less road maintenance and less traffic jams and detours for such work. A 50-year lifespan is expected.
- Space underneath. PlasticRoad is hollow and installed on sand, leaving room under it for cables, pipes and water. Traffic loop sensors, measuring equipment and connections for light poles could be installed under the road.
Plenty of plastic
The company plans to use plastic from the oceans and to collect plastic waste at incineration plants in Germany and the Netherlands.
There seems to be no limit to the amount of plastic available for PlasticRoad. Nearly 269,000 tons of plastic pollution may be floating in the world’s oceans. More than 55 percent of all plastic waste is still being incinerated, according to VolkerWessels.
“There is more than enough plastic for the construction of PlasticRoads,” they say.
The idea was conceived by looking at the problems that municipalities and contractors deal with. These include waste, alternative materials for roads, and the future shortage of oil, which provides an important component of asphalt.
Potential problems
There are some potential problems with PlasticRoad, according to its manufacturers. But because the pilot project is just starting, the extent of some of these is still unknown:
Noise. Like asphalt, a plastic road is expected to be quiet. Minimal noise pollution is easier with plastic than asphalt, according to PlasticRoad’s makers. Fears that a plastic road would act as a large resonance box for sound need to be investigated more, they say. If more noise is caused on a plastic road, that sound energy could be used to generate power, they say.
Slippery in winter. Work is being done to see if the plastic can be made skid resistant when wet. If that isn’t possible, sand or crushed stone could be applied to the surface by pressing or printing, providing the required roughness.
Releasing microscopic plastic. The company is investigating if friction and wear on the road will release microscopic plastic particles that are dangerous for people to breathe and for the environment. A wear layer or special coating should prevent this, they say. Research is being done to determine how durable the material is.
Toxic in fire. A fire retardant or fire resistant coating can be used to prevent PlasticRoad from becoming toxic in a fire. Research is still being done.
Effect of prolonged sun exposure. The civil engineering sector already produces and uses several products made from recycled plastic that have no problems with prolonged exposure to sun or UV-light, the manufacturers say. Examples include timbering, scaffolding, sheet piling, bridges and light poles made of plastic material.
Water in seams. Just as existing roads have seams where water can enter and damage a road, the seams of PlasticRoad are being studied for optimal design. Connecting the prefabricated parts will leave seams, and the firm is working on minimizing the effects. One potential risk, for example, is that the lightweight roads will float if groundwater levels are too high.
Replacing asphalt roads
If PlasticRoad is to be successful in the United States, it’s going to have to replace or supplement asphalt, which is used in a majority of U.S. roads.
Asphalt can last indefinitely and needs occasional maintenance, says T. Carter Ross, vice president of communications for the National Asphalt Pavement Association, or NAPA. Asphalt is recycled at a 99 percent rate to make new roads, Ross says. Recyclable materials such as roofing shingles, blast furnace slag and ground rubber from tires are used to make asphalt, he says.
Asphalt is 99 percent aggregate, he says, such as from stone, rock and sand. A petroleum product that’s the heaviest part of oil is used as the glue in asphalt.
A major benefit of asphalt is that it’s a smooth, fairly continuous surface that doesn’t have joints or cracks like concrete, Ross says.
“It’s a flexible pavement” that is quiet, smooth and creates 4.5 percent better fuel economy than a rough surface, he says.
Asphalt also has drawbacks. It’s malleable and moves, especially when heavy vehicles stop. A bus stop, for example, can have “mounding where the bus always stops,” says Keith Platte, an engineering expert at the American Association of State Highway and Transportation Officials, or AASHTO.
If that mounding will occur on plastic roads is a question to be answered, Platte says.
“The concept of plastic roads seems like a good one,” he says, but the devil’s in the details. Those details include how plastic roads will take repeated stops from heavy vehicles, how they hold up to snow plows, and rideability, he says.
Asphalt roads have been tested for years and have a sense of reliability and low risk of material failing that isn’t there yet for plastic roads, Platte says.
“How much of a risk are they willing to take on to put these out in full force?” he asks.
Concrete roads
Concrete pavement has been around since 1892. Most concrete roads have a design life of 20 years, though some last 30-40 years, compared to about 20-25 years that’s common for asphalt.
A drawback of concrete roads is that with the ground constantly being shaken by traffic, concrete can crack and extreme heat can cause expansion and contraction of a popout of the road, says Bill Davenport, vice president of communications for the American Concrete Pavement Association, or ACPA.
Normally colored white, concrete roads are made of cement, rock, sand and water, and other materials can be added, Davenport says. Strength and durability are its popular points.
“Concrete in itself is recyclable,” Davenport says. Old concrete can be crushed and recycled, sometimes on site during road construction, he says.
There’s also a product called roller compacted concrete, which is a drier mix of concrete that’s compacted by vibratory rollers and is typically constructed without joints. It’s considered fast and economical to install.
Davenport says he’s seen many road alternatives come and go. The testing of plastic roads is just beginning, he says, and lacks data and research.
“We are always open to learning about new technology, embracing new technologies if they have merit,” he says.
Why innovation in Europe?
Why plastic roads are being tested first in Europe instead of the U.S. is open for debate. It may be because Europe has a higher tax rate and less distrust of government, Platte says, which may lead to the government being more willing to take on such risks.
U.S. taxpayers may be more resistant to paying for such unproven roads. More than 90 percent of U.S. roads are built with public money or as public-private ventures, Davenport says, on a low-bid process. That mechanism for building roads may not be inductive to building roads that may have a higher upfront cost or aren’t proven to work well.
Or, like working less and paternity leave, Europe may simply be thinking ahead more and naturally considering recyclable road construction.
By Aaron Crowe
 As a lifelong resident of New Hampshire, Monique Prince is proud of the fact that she lives in the only state in the country that doesn’t require auto insurance.
“We come from a state where we should have our own freedom,” says Prince, 48, a clinical social worker who lives in Chester, N.H.
That freedom aside as the only non-compulsory auto insurance liability state, she has liability insurance anyway, paying about $500 per year to protect her in case she’s at fault in an auto accident. So far Prince hasn’t had to use the insurance, which wouldn’t cover damage to her car but would cover the other driver’s car if she caused an accident.
While New Hampshire law doesn’t require liability insurance, it does require that drivers prove they have enough money in an “at-fault” accident, which they can do by buying a bond or some other way to prove financial responsibility. Also, people who have been in previous crashes, have a DUI or other conviction may be required to have insurance.
“Why should I pay for that if I’m a good driver and I don’t get in an accident?” Prince asks.
To cover herself financially if she gets in an accident with an uninsured motorist and needs to pay to have her car fixed, Prince has an emergency fund to pay for car repairs and her liability insurance. Liability insurance pays the other driver’s medical, vehicle repair and other costs when the policyholder is at fault.
She has been hit once by another driver, and her first thought wasn’t about if anyone was injured: “This ‘blank’ better be insured,” she says of her initial reaction after being hit. The other driver turned out to be insured, Prince says.
Low rate of uninsured drivers in N.H.
That fear of being hit by an uninsured driver may be what convinces Prince and other New Hampshire residents to buy auto insurance anyway.
A 2012 claims study by the Insurance Research Council found that 9.3 percent of New Hampshire drivers were uninsured, ranking the state 34th in percentage of uninsured drivers. Oklahoma was the worst, topping the list with 25.9 percent of its drivers being uninsured. Nationwide, 12.6 percent of motorists are uninsured.
Compulsory auto liability insurance isn’t necessarily the most effective solution to getting more drivers insured. A 1994 study by the National Association of Independent Insurers found that New Hampshire had a smaller percentage of uninsured drivers than the nearby states of Rhode Island, Vermont and Connecticut.
“The lack of a mandatory insurance law doesn’t drive up the number of uninsured motorists” in New Hampshire, says Robert Passmore, assistant vice president of the personal lines policy at the Property Casualty Insurers Association of America.
What if hit by uninsured driver?
New Hampshire drivers who do buy auto insurance will want to have uninsured motorist coverage, says Larry Crowe, public information officer for the New Hampshire DMV.
“They’re pretty much on their own” if they’re hit and don’t have insurance, Crowe says.
If someone is in an accident and police don’t respond, and the combined damages were more than $1,000 or someone was injured, then a report must be filed with the DMV. If someone was driving your vehicle and was involved in a crash, then they would have to complete the accident report.
If an uninsured driver is at fault in an accident that causes $1,000 or more in combined damages or someone is injured, the state can suspend the uninsured driver’s license and registration privileges.
After the accident, those drivers will be required by the state to have insurance through what’s commonly called an SR-22 for at least three years after the accident, according to the DMV. It’s a form they can pay an insurance provider for, proving they have insurance.
Some convictions also require an SR-22, including driving while intoxicated, underage DWI, leaving the scene of an accident and a second offense for reckless operation.
Uninsured drivers who live in New Hampshire and are in a car crash can have their driving privileges suspended. If they can’t agree with the other party, they can post restitution with the DMV by sending in cash or a check, or by allowing the DMV to withdraw the amount from their savings account.
This payment is different from the proof of financial responsibility required by all drivers in the state, even if they don’t have liability insurance. They must show proof of $25,000 in bodily injury or death to one person, $50,000 for two or more people in an accident, and $25,000 for property damage.
Law seems to be working
New Hampshire has had this law for as long as anyone at the DMV can remember, Crowe says.
“Everything seems to be working OK, so why create the law” requiring insurance, he says.
The law also covers out-of-state drivers who cause accidents. For an uninsured driver who lives outside of the state and causes an accident in New Hampshire, their privilege to drive in New Hampshire will be suspended and their home state will be notified of the suspension.
For Prince, the state resident who considers herself an excellent driver, the law works — though she’s not sure about out-of-state drivers who may or may not be insured.
“If I see a Massachusetts license plate, I stay away from them,” Prince says. She wasn’t joking.
By Aaron Crowe
 Undocumented immigrants can find themselves in a Catch-22 if they want to drive and have auto insurance in most parts of the United States.
They can’t get a driver’s license in most states, and without a license, they often can’t buy auto insurance.
“They’re forced to drive without insurance and it’s a very dangerous situation,” says Bruce Coane, an attorney in Texas who specializes in immigration law.
All but 11 states and the District of Columbia prevent undocumented immigrants from obtaining a driver’s license. Without a driver’s license, most auto insurance companies won’t sell them an insurance policy, potentially creating legal, financial and other problems for the drivers and anyone involved in an accident with them.
Some insurers will still sell insurance to unlicensed drivers by having other requirements, but not having a license limits a driver’s options in obtaining insurance.
How many uninsured drivers?
There are an estimated 11.3 million undocumented immigrants — also called unauthorized immigrants — in the United States as of 2014, according to the Pew Research Center. That accounts for 3.5 percent of the nation’s population.
Undocumented immigrants aren’t U.S. citizens, and many are allowed to legally live and work in the U.S. if they have a work permit or green card that starts the process of becoming a permanent resident.
While President Obama has expanded deportation relief to almost half of the unauthorized immigrant population, 39 states won’t grant them a driver’s license — a document needed to get insurance and used in many other forms of daily life. Without being able to get a license, they may be driving uninsured.
While it’s difficult to know how many undocumented immigrants are driving without licenses and/or insurance, there are statistics on the overall percentage of uninsured drivers.
The Insurance Information Institute reports that 12.6 percent of drivers are uninsured nationwide, according to a 2014 study by the Insurance Research Council.
All states except New Hampshire require liability insurance, which pays for the other driver’s medical, vehicle repair and other costs when the policyholder is at fault in an accident.
Reasons for being uninsured go beyond being unable to obtain a driver’s license. Some people can’t afford insurance or may have so many traffic violations that their insurance premiums are too high.
Exceptions and other options
Eleven states and the District of Columbia allow undocumented immigrants to obtain a driver’s license. The states are: California, Colorado, Connecticut, Hawaii (in 2016), Illinois, Maryland, New Mexico, Nevada, Utah, Vermont and Washington.
A California law went into effect this year allowing undocumented immigrants who are state residents to obtain a driver’s license after they’ve passed driving exams. During the first six months of the year, the state issued 397,000 driver’s licenses to undocumented applicants, or more than half of the 759,000 licenses issued during that time, according to the California Department of Insurance.
Coane, the immigration lawyer in Texas, says he recommends a simple solution to some of his clients: Travel to a kinder state that will give them a license, and then return with an out-of-state license to the state where they live that won’t give them a license.
The friendly state may require applicants to live in the state for 30 days, which immigrants can do by staying with friends or family, or living in a motel. If they’re stopped for speeding in Texas, for example, but can show a New Mexico driver’s license, they may get a warning or ticket instead of being taken to jail for being an undocumented immigrant, Coane says.
But even if they have a driver’s license from another state, an officer may still require them to get a license in the state they live in within 30 days of an infraction, Coane says.
In Texas, he says, they’re more likely to be arrested for not having a license, while having an out-of-state license will just result in a ticket. In immigration court, Coane says he’s represented plenty of people who have been denied bond after being arrested because they were cited six or seven times for driving without a license. That can lead to deportation, he says.
For undocumented immigrants who arrived in the U.S. before age 16, they could get a driver’s license through the Deferred Action for Childhood Arrivals program in all 50 states and D.C. Called DACA for short, the program is no longer accepting requests due to a federal court order.
Still driving
It’s a fallacy to think that not allowing someone to get a driver’s license will prevent them from driving, says Alfredo Lozano, an immigration lawyer in San Antonio, TX. Undocumented immigrants have children to shuttle around and jobs to get to, and the lack of a license is unlikely to stop them from driving, Lozano says. What it will most likely do is prevent them from obtaining insurance, he says.
“The majority of undocumented people, the last thing they want to do is be on anybody’s radar,” he says.
Not having a license will at least get them a ticket if they’re stopped, Lozano says. One solution is to use a driver’s license from their home country, such as Mexico, to show to an officer, he says. It’s legal to drive with a license from your home country, he says, and the excuse of “I just moved here” can work with an out-of-state license.
If they do get a ticket for not having a license or insurance, or for any driving infraction, many undocumented immigrants won’t fight the ticket because they fear the judge may send them for in immigration hearing, Lozano says.
Lozano estimates that 50-60 percent of his clients who are getting a green card through their spouse or child don’t have a driver’s license.
Other ways to get insurance
Even without a driver’s license, there are ways to get auto insurance. Some Texas insurers sell liability insurance with any government identification, such as a passport, Lozano says.
This at least covers undocumented immigrants from possible lawsuits they might face if they didn’t have liability insurance.
Sometimes having a work permit can be enough help to getting a driver’s license, Lozano says. A work permit can allow someone to get a Social Security number, which can then make it easier to get a driver’s license, he says.
Another problem for people without a license is buying a vehicle and getting the vehicle title, Lozano says. That can be overcome by buying a car from a friend and keeping the vehicle registered in the name of the original owner.
What people should remember, especially in states that don’t provide driver’s licenses to undocumented immigrants, Lozano says, is that the main purpose of a driver’s license is to be able to drive legally so families can get to work and get their kids to school. Withholding it as a symbol of keeping tabs on who is in the U.S. legally doesn’t accomplish much, he says.
“A driver’s license doesn’t give you any status in this country anyway,” he says.
