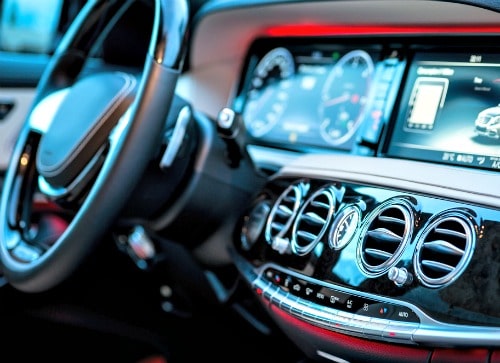
 For some people, plugging a little device into their car’s diagnostic port in exchange for a discount on their auto insurance is a no brainer. For others, no discount is worth allowing their insurance company to watch over their shoulder during their morning commute.
But, regardless of how you feel about them, those so-called telematics devices appear to be here to stay.
According to a recent study by Pew, about 37 percent of all drivers said they would be willing to install a telematics device in exchange for a discount on their auto insurance. Meanwhile, 45 percent of drivers said they wouldn’t consider such surveillance, with 16 percent of respondents saying it all depended on the details.
Nearly every auto insurer has a telematics program now, according to the National Association of Insurance Commissioners, and all but two us states allow insurers to use telematics devices to set premiums. Only California and New Mexico say they are off limits, however every program isn’t available in every state that allows it.
Progressive’s Snapshot program was one of the first telematics programs to be introduced. Since 2008, Progressive says it has saved more than 3 million drivers an average of $130 each policy period through the program.
Allstate’s program is called Drivewise. Liberty Mutual has RightTrack. State Farm calls its program Drive Safe & Save.
Different names, but telematics technology the same
Most of the programs operate essentially the same according to the NAIC. Typically they either use a plug in device or a mobile app installed on your smartphone. The plug in device goes into your vehicle’s onboard diagnostic port — the small plug under your steering column that your mechanic uses to test for engine faults.
That device typically tracks things like your acceleration, your hard braking, time of day you typically drive, how many miles you drive each day, and in some cases where you drive.
The smartphone-based programs are similar, but instead of a third-party device you plug in, you install the app and let it use your phone’s GPS and Bluetooth connection with your car to track your behavior.
In general, the insurers say that drivers can only benefit by using telematics programs.
“RightTrack can only help customers save on their insurance – no matter how they drive,” said Glenn Greenberg, spokesman for Liberty Mutual.
The insurers generally give you an initial discount merely for enrolling — say 5 percent — and then based on your driving, knock an additional chunk off — up to 30 percent.
Most of the companies say that you can’t be penalized for using the devices, no matter how hard you slam on the gas and the brake, but according to NAIC, that may eventually change as more and more drivers adopt the programs. As it stands, the insurers appear to be benefiting from a self selection bias that means that the best drivers are the ones that are signing up, while the drivers with lead feet are steering clear.
NAIC said that so far, each program has leaned on proprietary devices that feed proprietary data, meaning that if you get a 30 percent discount with Liberty Mutual and then switch insurers, that discount stays behind.
That might change moving forward with companies like Veririsk, which is working with automakers to collect drivers’ information from programs like General Motor’s OnStar or Honda’s HondaLink to create databases of driver behavior, much like credit bureaus collect people’s payment history.
With those third-party programs, your driving behavior, and potentially your discount, could then move insurers with you.
Driver discounts just the beginning
Aside from the discounts for using telematics programs, another major benefit is that the programs tend to change driver behavior for the better, according to an article published in the Insurance Journal, which showed that more than half of drivers participating in these programs reported that they have made changes in how they drive. That is because as people know they are being watched, they tend to engage in risky behavior less often.
According to NAIC, the best programs are the ones that give you a dashboard that allow you to log on and get regular feedback on each day’s driving behaviors. Programs that merely give a score at the end without that feedback don’t tend to effectively change driver behavior. NAIC also said those programs with regular feedback are the ones that insurance regulators tend to be more likely to approve, because they clearly tie specific driving patterns to specific pricing.
Another article in the Insurance Journal showed that Millennials are more likely than other age groups to take advantage of telematics programs — with 88 percent saying they are willing or interested in participating.
However, those younger drivers are far from the only people who are participating.
“The program has been popular across the board,” Greenberg said.
He added that telematics programs are especially helpful for parents who are teaching their teens responsible driving habits.

For young people, graduating from high school and leaving home for the four-year (or longer) adventure that is their college education is a rite of passage. Whether moving into a college dorm, getting their first part-time job, or finally being “out on their own,” the college experience is a journey from adolescence into adulthood.
Unfortunately, thousands of college students every year die before completing that journey. Research shows over 1,800 college students between the ages of 18 and 24 die from alcohol-related injuries annually (including drunk driving incidents).
To understand this tragedy and the college campuses around America where these accidents are the most prevalent, we analyzed FARS (Fatality Analysis Reporting System) data of fatal car accidents in and around college campuses. Read on as we explore just how serious – and deadly – college drinking and driving is today.


More than making it to class on time or getting good grades, drinking has become a ritual for many college students across the U.S. Experts suggest many young people acquire habits around drinking alcohol that stay with them years after the college experience has ended. Studies show roughly 60 percent of college students between the ages of 18 and 22 drink alcohol, even though many are not of legal age.
Beyond the negative effects that drinking can have on their academic careers, the consequences of drinking for college students can be deadly.
Between 2012 and 2016, 4.3 percent of all crash fatalities occurred within a three-mile radius of a non-city college or university. City colleges and universities were only slightly safer. During the same period, 3.5 percent of crash fatalities occurred within a 1.5-mile radius of city colleges and universities.
Fatal Accidents in Your Area
Every day, close to 29 people lose their lives as a result of alcohol-impaired car accidents. This equating to more than one person every hour, the total number of DUI fatalities in 2016 increased to over 10,000.
Using our interactive tool, you can see just how many of those crashes occurred at or near a college or university in your area. Sort by the type of school with the biggest student populations.
Over the Alcohol Limit


Across the U.S., the legal drinking limit is a blood-alcohol content of .08. Years of research have shown the effects of alcohol on a person’s ability to drive safely. When a national BAC limit was first introduced in 1938, the limit was just .15. According to the National Highway Traffic Safety Administration, almost all drivers become impaired drivers once their BAC reaches .08.
So how many drinks is too many? That depends. For the average 25-year-old man, between four and five standard mixed beverages with .60 ounces of alcohol can push his BAC over .08. For women, the number of drinks that could lead to dangerous (or even deadly) driving is even fewer. Just three standard mixed drinks would push the average 25-year-old woman over the .08 BAC limit.
Between 2012 and 2016, more than 1 in 4 crash fatalities at non-city colleges and universities involved a driver with a BAC level over the legal limit. These deadly alcohol-related accidents were even more common at city colleges. Over the same four-year time span, more than 28 percent of crash fatalities involved a driver with a BAC over the legal limit of .08.
Dangerous Driving

For fatalities that happen on or near college campuses, the most common days of the week are the same as virtually anywhere else in the country: Saturdays and Sundays. In 2016, twice as many alcohol-related traffic fatalities occurred on the weekends compared to weekdays.
Without the obligation of early morning classes or the looming responsibility of studying and homework, the weekends represent a prime opportunity for students to let loose and enjoy themselves. In some cases, that can mean turning to alcohol and potentially dangerous driving conditions. Even limiting binge drinking behavior to the weekends can be dangerous for young adults, as research shows alcohol can cause long-term brain development and mid-stage liver damage as early as 20 years old.
While fatal accidents involving impaired drivers were as likely to happen on the weekends near college campuses as anywhere else, college students may be staying up later before getting behind the wheel. Fatal alcohol-related crashes are 17 percent more likely to occur between midnight and 2 a.m. around college campuses than anywhere else in the country.
Safety at School
For the millions of young Americans who leave home to start the next chapters of their adult life, college is meant to be an exciting time. With new levels of freedom to explore and experiment with, there can be more to picking the perfect university or school than what you want to study or the profession you want to take on. Still, that newfound freedom can lead some students to experiment with drugs and alcohol for the first time, occasionally leading to deadly outcomes.
Before you pack up your books for the first day of class, make sure you have the coverage you need in case an accident should occur. Quality car insurance may seem expensive, but it doesn’t have to be. At CheapCarInsurance.net, our mission is to help you find the coverage you need at an affordable price. Our free rate comparison tool lets you explore the multitude of options in your area, break down their policies, and pick the plan that works for you. Don’t leave home without an insurance plan to keep you covered no matter what college life brings you. Visit us at CheapCarInsurance.net to learn more.
Methodology
All institution data were collected for this study using the Integrated Postsecondary Education Data System (IPEDS). We included all public and private nonprofit schools with 5,000 or more students enrolled. All crash data were collected using the NHTSA’s Fatality Analysis Reporting System (FARS). To determine what constituted a campus fatality, we used a 3-mile radius for rural, suburban, and town colleges, and a 1.5-mile radius for city colleges.
Fair Use Statement
Think your readers might be interested in this report? We don’t mind sharing our answers with you. Feel free to utilize the images or data found here for any noncommercial use, but just ensure a link back to this page so that our contributors get credit for their work too.
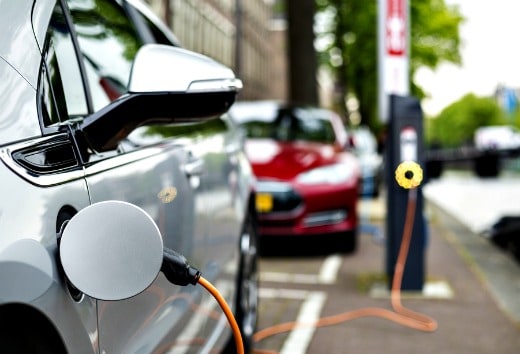 Drivers who want to eliminate emissions during their daily commute but still have the flexibility to take long road trips on the weekend are increasingly looking to plug-in electric hybrid vehicles.
Plug-ins are like their hybrid cousins in that they carry two drive trains – an all electric one running off a motor and battery bank – and a gasoline-powered engine. But plug-ins have the advantage of having much bigger batteries than traditional hybrids, allowing them to push 50 miles on all electric drive alone.
When their batteries are close to being depleted, they switch over and rely on the gasoline engine to recharge the batteries and to propel the vehicle down the road.
When you get where you are going, you can plug the car into an electric outlet and recharge for your next trip. And if your employer has a charging station, they pay for your fuel while you work.
One of the primary things holding many people back from buying an all-electric vehicle is so-called “range anxiety.” Even though today’s all-electric vehicles are getting more than 200 miles per charge, drivers worry that if their trip is at the edge of that range they may fall short and be stranded. Because plug-in hybrids can switch over to the gasoline drive, plug-ins save you from that anxiety.
Automakers have close to four dozen plug-in models to chose from, says Genevieve Cullen, president of the Electric Drive Transportation Association. Choosing between them is largely a case of picking what is important to you.
“You have to look at price point, electric range, vehicle size, and your own charging capacities,” Cullen says. “What is your daily commute? What are your range needs? What are you willing to spend? Are you going to pull a boat? What are you looking for? What are your priorities?”
Plug-ins come in a range of vehicles, from minivans to sports cars. Some have comically small all-electric ranges, while others easily get you through your daily commute and evening errands without running out of charge.
Some automakers, such as BMW, are offering plug-in versions for nearly every model they are offering.
“Buying a plugin vehicle is not about sacrifice. It is about optimizing what you want,” Cullen says. “You need to identify what you are looking for, and there is something in the plugin market that meets your needs.”
Joel Levin, executive director at Plugin America, echoes the sentiment that buying an electric vehicle is not about “sacrifice.”
“Electric drive is a fundamentally better way to move cars around than gasoline,” Levin says. “Electric is more powerful. It’s not like eating your broccoli. The performance is better. It’s cleaner. It’s more convenient.”
Electric simplicity means savings for drivers
One of the primary draws of the electric propulsion system is its simplicity, Levin says.
“Instead of hundreds of moving parts, it’s just a battery, electric motor and wheels,” Levin says.
Levin said that simplicity translates to lower maintenance costs. The all-electric mode also means you have no tail pipe emissions, and you are using locally produced electricity, rather than importing gasoline from other countries.
Some state, such as California, also allow electric vehicles to drive in the carpool lane even with just a single person in the car.
“One of the other advantages that people might not consider is it is a better driving experience,” says automotive expert Philip Reed. “It’s primary advantage is they feel very quick, they are very quiet, they handle well because their battery is on bottom with a very low center of gravity. They get great midrange acceleration and instant torque.”
Cullen also points out that once you make the initial investment, electricity costs about a quarter as much to operate the car than gasoline does.
Ronald Montoya, senior consumer advice editor for Edmunds also says that when you buy plug-in electric cars, you get a lot “thrown in” by the manufacturer.
“Because they are positioned as ‘showcase vehicles,’ they tend to be more nicely equipped,” Montoya said. “They typically have more standard options on them.”
This is not all to say that plug-in hybrids come without drawbacks.
Because the technology is still relatively novel, Reed said some people have the perhaps unfounded worry that the added complexity may lead to more maintenance issues.
“But all cars are complex now, so I wouldn’t worry too much about that,” Reed says.
As a new piece of technology, plug-in hybrids are still selling for a premium that you likely won’t recover in either the tax credits or the lower operating costs, Montoya says.
“If you are in it thinking you will save money overall, plug-ins might not be the best choice for you,” Montoya says.
The federal income tax incentive ranges from $2,500 to $7,500 for buying an electric vehicle, though the total credit depends on the size of the battery of the vehicle. Your ability to get that rebate also depends on how much income tax you pay each year. Many states, including California also offer state and even some local tax credits as well.
Because they have both gasoline and electric drives, plug-ins also are carrying around two power trains – and their added weight and complexity – which can be seen as a drawback as well, Reed says.
Another con – in some cases – is that insurance can be more expensive because if it breaks or get into an accident, the cost to repair can be higher, Montoya says.
“You might check with your insurance company to compare it to a non plug-in version before you buy it,” Montoya says.
There are also potential startup costs, such as adding a physical charging station to your home. And while adding a 240-volt dedicated charger does make it much faster to recharge your plug-in, it is not purely necessary. Plug-in hybrids can also use traditional 110-volt outlets, just at a slower recharging pace.
Resale values of electric hybrid cars
 Something else to be wary of is the resale value. Because they are still new, Montoya says there isn’t a robust market of people looking for used versions of them, which means their value drops comparatively faster than non-electric drive vehicles.
Levin also points out that the fact that the technology is changing so rapidly, people aren’t eager to buy the older version, but instead are choosing to opt for the newer versions, much like they are drawn to the newer versions of smartphones rather than two-year-old models.
Many dealerships also can’t seem to be bothered with the electric vehicles – many don’t carry them in their inventory, and many others hesitate to steer customers toward the ones they do carry.
“It is hard to find informed salespeople. They really do seem to have a general lack of interest in selling you an electric or plug-in,” Reed says.
For several years, many people have worried that the battery longevity just won’t hold up.
“But we haven’t seen that to be true,” Levin says. “The batteries hold up pretty well. People are more nervous about them than they need to be.”
He says that if you shop wisely, that misplaced prejudice against used electric vehicles could lead to some good deals.
Cullen says that is especially true in places where the electric vehicles get you in the HOV lanes.
Because the technology is changing so rapidly, and because of a quirk in the tax credit, most experts say that plug-in hybrids are uniquely good choices to lease, rather than buy.
When you buy a plug-in, you have to wait until the next tax year to claim the credit on your income tax. When you lease it, the dealership gets the tax credit immediately and can pass that money on to you in the form of lower lease payments.
Montoya says he strongly encourages people to consider leasing their plug-ins rather than buy them.
“The technology is changing so much that three years from now, the range might be twice as much. If you purchase a vehicle, you would still be making payments on it when you really would want to be able to take advantage of those advancements,” Montoya says.
Levin says the key to understanding plug-in hybrids is to head over to a dealership and give one a test drive.
“It’s really hard to understand in your gut until you have driven one,” Levin says. “They sell themselves. If we could get everyone to spend 10 minutes in an electric vehicle, the market would shift overnight.”
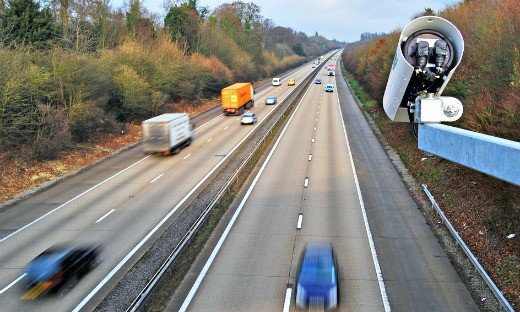 Drivers who live in cities with speed or red light cameras know the drill. They’ve learned — sometimes the hard way — where all of the cameras are positioned, and they’ve gotten in the habit of slowing down and obeying signals on photo-enforced thoroughfares.
But some cities are making it a bit trickier for drivers who think they’ve got this whole camera thing figured out.
Their latest weapon is the mobile speed camera — automated cameras mounted on parked vehicles, often without an officer present to operate them. These mobile units move from location to location, based on local enforcement needs. Many of these vehicles are marked, but some are not.
The purpose of these vehicles is to catch drivers who or speeding or running red lights in locations that lack fixed cameras.
Mobile speed cameras have been used most notably across in the United Kingdom, although they have been popping up in U.S. cities including New York, Dayton, Ohio; and Rio Rancho, New Mexico.
Red light cameras used as a deterrent
Mobile enforcement units have come under fire as yet another form of “Big Brother” enforcement and a way for cities to make money. But proponents praise these programs as a clever safety tool and an effective deterrent against hazardous driving.
“This is the ideal kind of enforcement, where you make people aware that photo enforcement is being used, but drivers don’t always know where the cameras are positioned,” says Russ Rader, spokesman for the Insurance Institute for Highway Safety. “That encourages them to slow down and obey the speed limit everywhere in the city.”
New Orleans is one of the most recent cities to implement its own fleet of mobile traffic safety camera vehicles. The city added 10 of these vehicles in 2017 to ticket drivers who speed and run red lights. The vehicles are marked with municipal logos to look similar to New Orleans Police Department vehicles, although there have been reports of some unmarked enforcement vehicles. There is signage about 300 feet in front of each traffic unit.
To supplement the rollout, the city also expanded its existing traffic camera safety program to include 45 permanently fixed cameras.
The mobile traffic units may be deployed at one location for several hours or a full day, depending on the police department’s judgment and enforcement requirements.
Citations range from $75 for going 1 to 9 mph over the speed limit, to $235 for exceeding the speed limit by 20 mph or more. Tickets for running a red light are $135.
City officials estimated that the camera program would generate $5 million in municipal revenues.
The city has touted the benefits of automated traffic enforcement. According to the city’s website, more than 80 percent of individuals who receive a traffic camera citation and pay it do not get another citation.
Officials cite demand for red light cameras
 The city also claims that it receives “daily requests to install new traffic safety cameras from residents and neighborhoods in response to speeding.”
Rader says the feedback his organization receives about traffic enforcement cameras echoes that sentiment.
“Something we hear from communities across the country is that community residents recognize the safety benefits of these cameras,” he says. “And when you’re walking, bicycling or sending your kids off to school, camera programs like this can give parents, especially, peace of mind that drivers are being discouraged from speeding in their neighborhoods.”
Rio Rancho, which uses both mobile and fixed camera units, defends the automated traffic enforcement as a safer alternative to traditional traffic law enforcement, which it calls “intensive and high risk.”
“When officers observe a violation, it is not always possible to safely stop the violator. It’s also impossible for police departments to monitor the roadways on a round-the-clock basis,” the site states.
Automated traffic enforcement has been both a source of controversy and a subject of praise.
Critics have questioned the legality of these programs and accuse the cities that use them of being financially motivated.
The constitutionality of various types of automated enforcement laws has been challenged in many jurisdictions, but few challenges have been successful, according to the National Conference of State Legislatures.
Where red light cameras are against the law
Several states have outlawed cameras altogether.
According to the Insurance Institute for Highway Safety, 10 states prohibit localities from using red light cameras, speed cameras or both.
As of April 2018, there were 422 communities with red light camera programs and 143 communities with speed camera programs.
Arizona was the first state to adopt mobile cameras on its highways in October 2008, but also became the first to discontinue the program after activists complained that the cameras intruded on privacy and were put in place to make money.
In 2009, the operator of a van carrying a mobile speed camera was shot to death on the side of the freeway. The victim’s family filed a lawsuit against the Arizona Department of Public Safety.
In 2017, Louisiana lawmakers attempted to outlaw all traffic enforcement cameras, but their plan was defeated in a 14-1 vote by the Louisiana House Transportation Committee.
Louisiana state Rep. Paul Hollis claimed that polls showed heavy opposition to traffic cameras and criticized the cameras as a revenue scheme.
“They are about one thing; they are about money. Nothing more,” Hollis told the committee.
Rader says there’s a simple way to keep cities from making money on speeding tickets.
“If you’re philosophically opposed to sending revenue to the city, don’t break the law,” he says.
Proponents of automated enforcement see mobile cameras as another weapon in law enforcement’s battle against dangerous driving. Bringing mobile camera units into the mix provides another element of safety, Rader says.
“It’s a way to expand an existing program and make it more effective,” he says.
Although there are no available figures on mobile speed-camera enforcement specifically, the best-controlled studies suggest injury crash reductions are likely to be in the range of 20 percent to 25 percent at fixed camera sites, according to the Centers for Disease Control and Prevention, citing a 2008 study.
“Speeding is one of the most persistent road safety programs that we have. And it leads to the deaths of thousands of Americans every year,” Rader says. “If we could make speed cameras a counter measure that is used everywhere across the country, you could save a lot of lives.”
 It’s time to renew your auto insurance. When you open your renewal notice, you discover that your premium has jumped by $15 a month. But you didn’t get any tickets and you weren’t involved in any accidents. Why, then, is your premium rising?
Consumers often think that their auto insurance premiums won’t rise if they have a clean driving record. What they don’t know is that other factors sometimes cause the cost of insurance to jump.
Some of these factors are obvious: Your rates will increase if you add a new teen driver to your insurance. They might also rise, though, if you move to a new neighborhood or get a new car.
They might even jump if the drivers in your metropolitan area get in a lot of their own accidents, despite your perfect driving record.
Factors affecting insurance premiums
John Erickson, vice president and chief product officer at Wawanesa General Insurance Company in San Diego, says the goal of insurance companies is to collect enough premiums to pay their losses and cover their expenses. This means that they must predict in advance how many losses they will pay and what the average costs of these losses might be.
Insurers rely on a host of factors to determine how likely you are to get into an accident and file a claim on which they’ll have to pay. This includes your driving record, the miles you drive in a typical year, how many years you’ve been driving, the car you drive and where you live.
But insurers also look at more macro factors.
“Over the past few years, insurance companies have seen the number of accidents and associated claims sharply rise,” Erickson said. “This is a result of multiple factors, the two largest being increased driving as the economy strengthened and more distracted driving as smartphones became an integrated part of our daily life.”
So your rates might rise simply because people are still answering text messages while driving and, because they’re earning more money, are spending more time on the road taking trips.
At the same time, the cost involved in settling accident claims has risen during the last several years, Erickson said. Newer vehicles simply cost more to repair, which means that auto insurers often have to pay out more to their clients who have suffered accidents.
“A bumper repair that once cost $1,500, can easily reach $5,000 or more on a new car with sensor technology,” Erickson said. “The cost of medical services for people injured in accidents has been increasing much faster than general inflation.”
A hike with a clean driving record?
Abigail Vytlacil, licensed insurance agent with League City, Texas-based Larry Hudson Insurance and Financial Services, says that it’s not uncommon for drivers to get hit with premium hikes even if they’ve done nothing wrong on the roads.
That’s because most insurance carriers factor their rates on the law of large numbers. This means that individual drivers are pooled into a group based on geographic location, usually a township, city, county or zip code. The overall risk for each region is determined by the total number of claims and the total amount paid out for claims in that area.
Vytlacil points to Houston as an example. The Houston market, of course, has a lot of drivers and heavy traffic. Commuters here drive an average of 30 miles to and from work each day. This means that the Houston market is a risky one for auto insurers. And if the accident ratio for the area in which you live goes up? Your premium might do the same.
“So, you may not have had an accident, but the accident ratio for the group you’re in might have increased,” Vytlacil said. “That means your policy presents more risk to the company. Your rate will go up because the company feels like you present a higher risk and the likelihood of an accident, even one not your fault, has gone up.”
Individual insurance factors
Sophia Borghese, a consultant for auto dealer Superior Honda in Harvey, Louisiana, said that there are other, more individual decisions that motorists make that can result in premium increases.
Maybe you took a new job that pays better. But maybe that same job comes with a longer commute. That can pump up your auto insurance premium. Or maybe your former employer offered you a group discount on car insurance. That discount will disappear when you take on a new job.
Then there are your children. When your young children start driving, expect your auto insurance rates to soar. That’s because younger drivers are more likely to get into accidents. When you put these teen drivers on your insurance, your insurance company will have to increase your rates to make up for this risk.
Moving can impact your insurance rates, too. Maybe you’ve moved into a zip code that has higher rates of car break-ins. This can cause your insurer to tweak your premiums.
“Even if you have yet to rear-end a driver or fall into a treacherous pothole, your insurance rate might still increase,” Borghese said. “Seeing a rate change if you haven’t done anything is nothing but a source of frustration. However, there are many things other than claims and fender benders that rack up insurance rates.”


Getting work done on your car can be a long and tedious task. The idea of waiting hours in a shop for work that doesn’t seem urgent creates a lot of procrastinators – especially when it comes to tires. Replacing tires in the case of a flat is an obvious move, but when tires seem to be running fine, many forgo the recommended replacement in exchange for saving a chunk of change.
Putting off a tire change may seem harmless, but worn out treads pose a considerable threat to your safety. Without good treads, your car can’t grip the road the way it needs in order to safely maneuver adverse weather conditions, increasing the risk of collision. So how many vehicles are being supported by insufficient treads? We conducted the penny tread test on 232 vehicles across three major U.S. cities to find out.
Passing the Penny Test

Fifty percent of all vehicles tested in our research had insufficient treads. However, failing the penny tread test wasn’t evenly distributed across vehicle types. Trucks had the highest pass rate at 71 percent, slightly more than convertibles and coupes. Wagons have the lowest pass rate of all vehicle types, with only 20 percent passing the tread test.
The distribution isn’t equal across tire locations either. Although existing research says front tires wear out more quickly due to turning, our study found the opposite. Right rear tires were the most worn down, with 35 percent failing the penny tread test, followed by left rear tires with 31 percent failing. More than 70 percent of both front tires passed the test – the front left being the least worn down of all four locations.
Check Your Treads
It only takes a penny and a few seconds to test the tread of your tires. Catching wear and tear early and not putting off replacement can help protect you and your vehicle. Taking care of your treads isn’t the only way to take care of your car, though.
Having the best auto insurance adds another layer of protection for you and your vehicle in the event of an accident. At Cheap Car Insurance, we can help you find the lowest insurance rates on the market. Visit us at CheapCarInsurance.net to compare coverage options for free and ensure you’re getting the most out of your policy without breaking the bank.
Methodology
We conducted the penny tread test on 232 vehicles across three major U.S. cities. Tires in which the tread did not extend beyond the head of Abraham Lincoln were defined as a fail. In an analysis of pass and failure rates for total vehicles or vehicle type, tests in which at least one tire had insufficient treads were defined as a fail.
It is possible that with additional vehicles tested, we could have gained more insight into this population.
Fair Use Statement
Worried your tires won’t meet President Lincoln’s standard? Feel free to share the results of our research with your audience for any noncommercial use. Just don’t forget to link back to this page to give the authors proper credit, though.

Ah, the open road. Whether you love it or hate it, driving is an integral part of our daily life: Americans spend an average of over 17,600 minutes in the car every year. That’s a lot of audiobooks, radio shows, and podcasts. But what drives us to drive? What compels us to strap in for expeditions far and wide? What powers the famed all-American road trip? According to over 1,000 survey respondents: football and burgers, among other things. Read on to find out how far people are willing to go to get what they want. Buckle up!
Rides on the Road
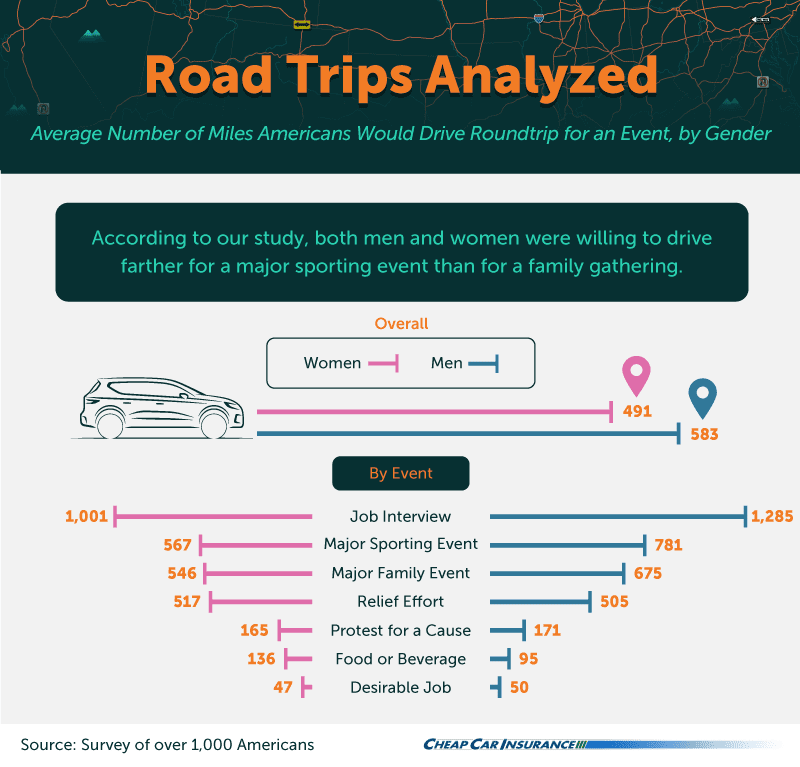
Our survey showed men had a greater desire than women to remain behind the wheel for longer stretches – a fact so oft-observed it has been baked into advertisements. Women reached their maximum distance at an average of 491 miles, whereas men were willing to drive farther at an average of 583 miles.
When the driving was broken down by event, however, there was a slightly elevated degree of evenness. Of the seven excursions shown above, men were willing to drive farther for five of them, and women would go the distance for two – a relief effort or specific food or beverage. Both groups were most likely to buckle up for a job interview, with men at an average of 1,285 miles and women at 1,001 miles. The largest discrepancy was seen in the third most popular event, a sports game: Women would drive an average of 567 miles to grace the bleachers, while men would hit the road for a whopping 781 miles. Go, team!
Fan Fervor

Americans have spoken, and they want you to take them out to a college football game, a PGA event, or a soccer game, depending on where they are from. While football is often regarded as America’s favorite sport, our study revealed people were more likely to go the distance for soccer and sports other than professional football. Westerners said they would travel the farthest for some college football action, while Southerners would go the second farthest distance for a golf tournament.
Sports Leagues Ranked

No matter where they hail from, nearly everyone has a sports league that’s bound to get them out of their seats and into the car. For the majority of Americans, that league is the NCAAF or college football. Even though college football viewership was down overall in 2017, our respondents’ love for the game remained well-fueled: They were willing to drive an average of 773 miles to sit in the stands. MLS and PGA rounded out the race between the top three sports leagues, at 764 and 731 miles, respectively.
Between men and women, the most outstanding discrepancy was between PGA fans. Women who wanted to see the golf game of the year were willing to drive a whopping average of 1,114 miles, higher than any other distance on the board by hundreds of miles. Men felt the exact opposite, offering only 543 miles on average – a few hundred miles less than men’s first, third, and fourth slots. It seems that PGA’s third-place spot was sustained entirely by the female population!
Culinary Cults

This map confirms the love for fast food is alive and well. Using the example of the cult of In-N-Out Burger, consumers are willing to go the distance for what they want. Taco Bell, in particular, can pull in foodies from the West from an average of 948 miles away, a force more powerful than its chicken-centric cousin.
As was the case for sports games, the West was once again the most gung-ho about a road trip – this time, for the love of food and drink. The average resident was ready to drive at least 721 miles for Chick-fil-A, and even farther for Jack in the Box and Taco Bell. The Midwest and South indulged in name-brand fried chicken and burgers, while the Northeast craved a West Coast original, In-N-Out, enough to drive nearly 700 miles to consume it.
Fast Food Destinations Ranked

There’s something about Checkers that has Americans willing to go to serious lengths for a mouthful of burger. People were willing to commute over 1,000 miles for their burgers and fries, a number propped up largely by male respondents: They had an average of 1,365 miles in their tanks in the name of Checkers, while women had about half that amount. In February 2018, this fast-food giant took a comical stab at Taco Bell, our survey’s third-place joint – kick ’em while they’re down, Checkers!
The male and female opinion varied wildly for this portion of the survey, though, with certain restaurants like Taco Bell, Arby’s, and KFC divided along gender lines. Second-place In-N-Out Burger was a crowd pleaser for all, with both men and women willing to drive approximately 650 miles apiece.
Conclusion
According to our study, some Americans would be willing to drive hundreds of miles or more depending on the occasion or destination. In fact, in 2015, Americans drove a record 3.15 trillion miles – meaning it may be safe to assume the road trip is here to stay. No matter the distance you’re willing to go for a once-in-a-lifetime sports event or fast food craving, drivers need to protect themselves and their vehicles: Spending time in the car means opening yourself up to the possibility of certain road hazards.
Put your mind at ease and focus on the beauty of the open road by purchasing the right insurance. Don’t leave the driveway before visiting CheapCarInsurance.net for a quote that suits your needs and lifestyle.
Methodology
We surveyed 1,012 Americans about the events they would drive for. We had 469 male participants and 543 female participants, with an average age of 37.5 years and a standard deviation of 12 years. Participants ranged in age from 18 to 81 years of old.
We weighted the data to the 2016 U.S. census projections for gender and state. Hypotheses were not statistically tested. We excluded respondent answers that exceeded 9,000 miles as a distance a respondent was willing to drive.
The data we are presenting rely on self-reporting. There are many issues with self-reported data. These issues include but are not limited to: selective memory, telescoping, attribution, and exaggeration.
Fair Use Statement
Want to take our studies on the road? Feel free to share this with fellow adventurous drivers for noncommercial purposes only, but don’t forget to credit us for the work.

Every year, more than a million Americans are arrested for driving under the influence. That number represents just a tiny fraction of those who get behind the wheel intoxicated. According to the latest CDC reports, 111 million Americans drive drunk annually. Thousands of people die every year as a result, many of them quite young. In 2015, more than one in five fatal drunk driving accidents involved a driver aged 24 or younger.
While statistics of this kind are a bracing testament to the consequences of intoxicated driving, they aren’t entirely surprising. Due to extensive public policy and education efforts, Americans are typically aware of the risks drunk driving entails. Some of these initiatives have yielded significant improvements. Since 1983, when their iconic “Friends Don’t Let Friends Drive Drunk” campaign first aired, the Ad Council suggests that 68 percent of Americans have tried to stop someone from driving after they’d been drinking. But despite these widespread and well-funded warnings, a sad truth remains: Drunk and drugged driving continues with alarming frequency across the county.
In this project, we studied why Americans continue to take the wheel when wasted, ignoring the known risks. Surveying 1,000 adults, we asked them about their motives for driving drunk or high and the circumstances that produced these dangerous decisions. Our participants revealed a startling array of justifications, suggesting some of the reasons that America’s drunk driving problem remains.
An Overwhelming Majority Under the Influence

First, let’s examine the prevalence of driving under the influence as admitted by our respondents. While men were slightly more likely than women to report driving under the influence, nearly three-quarters of respondents admitted to driving drunk or buzzed in the last year.
Apparently, that dangerous habit was established at an early age for some, with nearly 41 percent of respondents admitting to drunk driving before the age of 21. These findings resonate with fatal crash statistics, which indicate that 17 percent of all fatal drunk driving crashes involve a driver younger than the legal drinking age.
Perhaps some these respondents felt a lack of dependents limited their risks. Nearly 77 percent said they’d be less likely to drive drunk if another person, such as a child, depended on them for support. While this finding is encouraging in some respects, it’s also a seemingly strange reflection of our thinking: We’re relatively willing to risk our lives when we’re only responsible for ourselves.
Deciding to Drive Drunk: Causes and Context

Apparently, our respondents view drunk driving primarily as a matter of necessity. When offered an alternative, nearly three quarters of respondents took it every time. But those who insisted on driving themselves under the influence were often motivated by misguided confidence in their driving abilities. More than a fifth of participants said they felt they could drive while intoxicated, while others said they made a choice to drive despite being dangerously impaired; in their intoxication, they simply underestimated or disregarded the risk.
When it came to their behavior as passengers, a majority said they’d gotten into a car driven by a drunk person before. In this case, the most common cause was drunk misjudgment: They understood the risks but elected to ignore them. Others said they felt confident in the abilities of the driver or didn’t feel they were too impaired to drive. Only a small number said they did so because they had no alternatives.
Drunk Driving Deeds

Aside from dangerous outcomes, our respondents reported their drunk driving experiences included many scenarios, ranging from the banal to the bizarre. It seems one reason people drove drunk was to pick up snacks (or possibly more booze) from late-night locations like fast food drive-thrus or 24-hour establishments. Intoxicated drivers also recalled some absent-minded errors, like leaving doors and windows open. While these mistakes aren’t particularly threatening, they do reveal impairment: If you forget to turn your headlights on, you may fail to remember other essential rules of the road as well.
Other actions related to drunk driving incidents were potentially more problematic. While relatively few reported causing damage to other people or property, this may be because some averted those events by pulling over when they realized they were too drunk to drive. Many remembered embarrassing indiscretions, like driving to an ex’s house or calling them while driving.
Intoxication Estimation

While not drinking at all is likely the best way to prevent ambiguity about your ability to drive, our respondents varied widely in their predictions about how much they could safely drink before driving. Interestingly, many of our respondents said they could drive after drinking more than the amount needed to feel alcohol’s effects. This view runs contrary to recent public awareness campaigns, such as the “Buzzed Driving Is Drunk Driving” ads produced by the Ad Council and National Highway Traffic Safety Administration.
This concerning trend was particularly true for those who felt alcohol’s effects after one to two drinks, with more than two-thirds saying they believe they could still drink more and drive. Those who stated that they could feel alcohol’s effects after three to four drinks were less likely to feel confident in driving past that limit, though more than 38 percent said they could drive.
An Education in Alcohol

As institutions of higher education grapple with binge drinking on their campuses, we considered how drinking and driving experiences might correlate with various levels of educational attainment. When we asked participants who’ve blacked out about how they arrived home the night before, we saw a broad consistency among those who had at least some college experience. Whether they attended only some college or had obtained an advanced degree, between 21 percent and 28 percent of those with postsecondary educational experience woke up without remembering their trip home.
Those whose education ended in high school were slightly more likely to have this experience, with nearly a third recalling at least one instance of this kind. By contrast, those who attended a vocational or trade school were the least likely to admit not remembering how they got home.
Intoxication by Other Means

While drunk driving remains a troublingly commonplace occurrence, other drugs account for many deadly incidents as well. In fact, a recent report from the Governors Highway Safety Association found drugs account for more deadly accidents than alcohol in the latest national figures. In our findings, roughly 3 in 10 drivers drove under the influence of a substance other than alcohol, with marijuana being the most common intoxicant.
While researchers have arrived at conflicting results in their attempts to assess the effects of marijuana on driving abilities, the dangers of the second ranked substance, cocaine, are well-established. Drivers using the substance have demonstrated reckless and aggressive tendencies behind the wheel, and one can imagine the risks associated with operating a vehicle while using hallucinogens as well. High rates of opioid and heroin use nationally have also translated to roadway dangers of late, with users passing out behind the wheel.
A Sobering Look at Safety
While this project’s findings demonstrate the scope of America’s intoxicated driving problem, an important distinction must be made. The frequency with which Americans drive drunk does not excuse its danger or lessen our shared responsibility to encourage safer choices. We hope this report continues awareness of an issue that remains unresolved and gives readers reasons to reflect on their driving behavior, as well as that of those they love.
For any danger you face on the road, CheapCarInsurance.net is in your corner. With extensive resources related to insurance and driving safety, we’ll help you and your family take every safety precaution possible.
Methodology
We surveyed 1,000 American adults about their experiences with driving under the influence of drugs and alcohol. We then studied their responses in light of demographic information they provided.
Fair Use Statement
If you’d like to spread awareness of the prevalence of drugged and drunk driving through the use of this content, we encourage you to do so for noncommercial purposes. Please provide a link to this page, so your readers can explore the full findings of this project. If you have any questions, feel free to reach out to [email protected].

Swapping your high heels for a pair of driving shoes can help you qualify for affordable car insurance by avoiding accidents and getting “safer driver” discounts.
It’s easier to get discounted car insurance with a car that has a high safety rating than one without one.
When you are looking for car insurance, ask if the insurance company offers a policy where they forgive the first accident.
Remind Me to Save Again!
Want to remember to get quotes later? Get a reminder!
By Craig Guillot
 As more states move to legalize recreational marijuana, regulators and authorities around the nation are grappling with how to better measure if motorists are too high to drive.
Research from the University of Iowa shows means of testing for marijuana impairment could potentially let impaired drivers off the hook while penalizing others who haven’t consumed marijuana in weeks.
Twenty-nine states and the D.C. allow marijuana to be used legally in one form or another. Recreational marijuana use is legal in California, Massachusetts, Maine and Nevada.
Alabama and Mississippi both have laws permitting marijuana for medical use, but only for severe epileptic conditions.
States with legalized marijuana have recently a rise in marijuana-impaired driving. Information from the Colorado State Patrol revealed that the DUI/D (Driving Under the Influence of Drugs) citations related to marijuana increased from 12.2 percent in 2014 to 14.5 percent in 2015.
A CDOT survey found that 21 percent of respondents who used marijuana in the past year had driven a vehicle after consuming it within the past month. Those who drove within two hours after using marijuana did so 17 times per month on average. The survey noted that many drivers aren’t fully aware of the consequences of driving high.
“Our research indicates that unfortunately a lot of marijuana users are driving high and many believe they will not get a DUI for doing so,” says Amy Ford DCOT spokesperson.
Data on the topic, however, is still sparse.
What’s too high to drive?
Authorities are cracking down but there isn’t yet a scientifically-based national consensus on how to determine if a person is “too high to drive.” In Colorado and Washington, a person can be charged with DUI if a blood test reveals THC concentrations of 5ng/ml or higher. In Oregon, authorities can use a urine test and the officer’s observation to determine if the driver is impaired.
Dan Estes, impaired driving manager for the Oregon Department of Transportation, says the testing “isn’t perfect” because a urine test only shows the person consumed marijuana in the past and doesn’t prove that they’re currently under the influence. According to a report by the National Drug Court Institute, carboxy-THC can be detected in urine for up to 30 days.
Timothy Brown, associate research scientist at the University of Iowa’s National Advanced Driving Simulator, co-authored a study on the use of marijuana impairment on driving. He says THC is processed differently than alcohol and can stay in the body for much longer periods of time. This means blood, urine, and even hair tests don’t produce accurate results to determine impairment.
“If someone smoked a joint 8 hours ago and still has residual THC in their system, is that still having an effect and still crossing the blood/brain barrier? We really don’t know and it’s difficult to say when that effect in the brain is present,” Brown says.
Brown says what they do know is that THC concentrations spike high in the blood immediately after dosing. With alcohol, Brown says effects in the brain are “very well tied to” blood alcohol content that can be easily measured with years of research indicating that a .08 blood alcohol content makes a person too impaired to drive.
Brown says a chronic user of marijuana could have a concentration of “THC that’s always going to be there” even if they are not under the influence at the moment. He says the presence of THC does not prove impairment nor is there a scientific consensus on a level of THC that would indicate a person is too high to drive.
“It’s really a challenge. There are many additional questions you need to consider when looking at chronic users because there could always be [that level of THC] in the blood,” he says.
Paul Armentano, deputy director of the National Organization for the Reform of Marijuana Laws, says law enforcement should focus on testing performance measures “rather than relying on the detection of compounds that are not consistently associated with behavioral impairment.”
Armentano advocates things like MyCanary, a mobile phone based human performance app which tests memory, balance, reaction time, divided attention, and time perception.
Will police implement marijuana testing?
Brown says for a “complicated drug” like THC oral fluid samples can be a more precise and accurate way to test. While there is no such testing method on the market, such products are in development. Kathy Stitzlein, a biomedical engineering PhD student at the University of Akron, is a co-developer of Cannibuster, a microfluid device that uses noninvasive saliva testing to detect THC levels in a matter of minutes.
Stitzlein says they are currently testing of an alpha prototype and hope to soon start beta testing a device in the field.
“We’re looking at various, non-invasive ways to test bodily fluids at the roadside and are currently testing with saliva which can offer more current values,” says Stitzlein.
British Columbia-based Cannibax Technologies is also developing a THC breathalyzer that is similar to an alcohol breathalyzer and could detect impairment in minutes. Cannibax says the system would detect recent marijuana use within a two hour time period at time of testing.
Editor’s Note: This is an updated version of an article published on April 11, 2016.
By Dan Rafter
Heading to traffic school to keep your insurance premium from rising? Paul Trowe can tell you what to expect: boredom, and plenty of it.
Trowe, the chief executive officer of Austin, Texas-based video game company Replay Games, has attended traffic school or defensive driving both in person and online to keep a series of speeding tickets from boosting his insurance bills. Going to traffic court did keep the points from his violations off his driving record, and this did keep his car-insurance payments from increasing.
This doesn’t mean, though, that Trowe enjoyed his time in traffic school. Trowe described traffic school as “sitting through six hours of hearing the teacher lecture and watching mind-numbing videos.”
Most drivers who attend traffic school are like Trowe: They sign up for classes, either in person or, if they are eligible, online, to keep points off their driving record. No one considers going to traffic school to be a fun experience, even if attending classes will ultimately save them money in the form of lower insurance bills.
But what about you? If you’re headed to traffic school, what can you expect? Besides the boredom, that is?
Basics of defensive driving
Cherylyn Harley LeBon, a lawyer and commentator in Washington, D.C., went to traffic school earlier this year after pleading guilty to making an illegal u-turn. Like Trowe, she signed up for school to keep her insurance rates from soaring.
LeBon actually went to traffic school twice: First, she attended an eight-hour course on the basics of safe driving, attending traffic school for two separate four-hour sessions. She also took a four-hour reckless-driving course. All of the coursework was completed in a classroom, and none of it required any time behind the wheel of a car.
“That second course was not required. I took it on my own as a show of good faith,” LeBon said. “I wanted to show the judge that I was trying to be a more conscientious driver.”
LeBon said that traffic school was worthwhile, if not exciting. In the basic defensive driving course, instructors focused on teaching the rules of the road that you learned when first getting your license as a teen, everything from how far drivers should behind the cars in front of them to when they need to follow the lower speed limits posted in school zones. The instructor took breaks from lecturing to show videos and take questions from attendees.
RELATED: What to Do After a Parking Lot Accident
The class ended with a final exam that all participants had to take and pass.
More states now allow motorists to take traffic school online. Trowe said that if given the choice, drivers should go this route. It’s simply less boring than sitting in a classroom all day, Trowe said.
The online class that Trowe attended ran for six hours, with each Web page of the course coming with its own timer to make sure that participants didn’t just click through without actually reading the material.
The online course was broken into six sections, dealing with such issues as how to merge properly when entering a highway, how to drive properly when moving through construction zones and the dangers of distracted driving. Each section ended with a quiz.
Trowe, though, said that even the least studious should be able to pass these quizzes.
“The quiz is so easy, you could just guess all the correct answers if you wanted to,” Trowe said.
Jordan Perch, a blogger at automotive Web site DMV.com, said that attendees shouldn’t be surprised by the boredom. Traffic school is designed to provide motorists with a refresher on the rules of the road, not for entertainment.
“Classes are typically not very pleasant or exciting,” Perch said.
Why go to traffic school?
 So, why should you willingly sign up for a four- to eight-hour course? Perch says that it’s all about keeping those points off your driving record.
“Attending traffic school can be of great benefit in terms of avoiding financial losses further down the road, as well as avoiding a license suspension,” Perch said.
It’s no suprise to learn that speeding violations, or even a failure to stop at a stop sign, can cause your insurance rates to increase. Insurance companies will check your driving record and any blemishes can end up costing you.
Usually, though, those costs — at least the first ones — can be mitigated by attending traffic school.
Perch said, too, that by keeping points off the driving records of motorists, traffic school makes it less likely that drivers will have their licenses suspended, something that could happen if drivers rack up too many points in too short of a time.
ALSO: 25 Ways to Save on Car Insurance
Not all violators, though, are eligible for traffic school. In California, you aren’t eligible if you’ve attended traffic school for another ticket issued within 18 months of the date of your new ticket. You can’t attend if you are convicted of driving more than 25 mph over the posted speed limit.
You also can’t attend if you are convicted of a violation that counts for more than one point on your record. Such violations include driving with a suspended license, failing to stop at an accident scene, speeding in excess of 100 miles an hour and reckless driving.
Traffic school won’t help your pocketbook, either. You’ll still have to pay the fine associated with your ticket. You’ll also have to pay for attending traffic school. In California, state-required driving school costs $64.
Editor’s Note: This is an updated version of an article originally published on July 28, 2016.

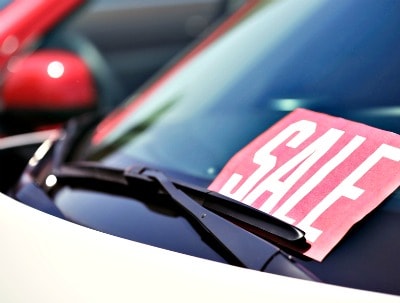
The average car in America is over 11 years old and is owned by its original owner for roughly six years.
Considering the speed at which car technology seems to be evolving, it’s easy to see why some people may be interested in buying a new car––or giving their vehicles a bit of a facelift. From tinting the windows to replacing the tires, you may eventually find yourself in the market for aftermarket parts not provided by the dealership.
Of course, once six years are up with that car, you may also find yourself looking to sell it and move on. So how will your aftermarket upgrades help (or hurt) the perception and value of your ride? We polled around 1,000 Americans to find out. Here’s what we discovered.
What to Consider and What to Axe


Some aftermarket car upgrades may seem like no-brainers. Whether you’re looking to increase the value of your vehicle, the comfort, or even just the prestige when driving down the road, car experts agree certain upgrades can pay off in the end.
Nearly 71 percent of Americans polled agreed nicer tires were the coolest additions to make their rides stand out. There are plenty of aspects to consider – more than just the aesthetic they provide, upgrading your tires can make the way your car drives feel smoother. An upgraded speaker system and tinted windows also earned a thumbs-up for appearance and presentation by more than half of people surveyed.
Some aftermarket options can add style, but not every upgrade is bound to look as cool. While more than 1 in 4 people thought upgraded rims looked good, fancy rims were voted the most obnoxious upgrade people could do to their cars. A third of Americans weren’t impressed by oversized tires or racing seats either, and considering how high the cost can go on some of these unsightly extravagances, your investment may be better spent elsewhere.
Take It or Leave It

If you’re looking to increase the value of your car, these are the upgrades most likely to cause Americans to do a double take, and the upgrades that might make them look elsewhere instead.
Nearly 2 in 3 people said if a car had nicer tires, they might be more likely to purchase it. Almost 43 percent of people felt cars with tinted windows were also a bonus, in addition to a nicer speaker system. Replacing your vehicle’s speakers might not just upgrade the quality of the sound – it can also be significantly cheaper to make the upgrade after buying..
If you’re interested in ensuring the internal components in your car are as light as possible, then racing seats might be the choice for you. If you’re looking for high resale value, on the other hand, they might be a hard pass. More than 2 in 5 Americans admitted they’d be less inclined to purchase a car that came preinstalled with racing seats. The idea of fancy rims and bigger tires would also make roughly a third of those polled race away from the auto dealership.
What Men and Women See in Cars

When it came to buying new cars, men and women had different opinions on what mattered most. Research has shown that women influence purchasing decisions 85 percent of the time and tend to favor practicality over emotional wants. While women are more concerned with safety and reliability, men tend to show more interest in how powerful the car’s engine is or how fun it is to drive.
Our study found men and women had differing opinions when it comes to aftermarket upgrades as well – though not exactly in line with the notion that women are exclusively concerned with practicality. Women thought upgrades like nicer tires, fancy rims, and tinted windows looked cooler than men did. Still, men did appreciate some of the less practical upgrade options, including sports racks, racing seats, and larger tires.
Purchasing Preferences of Men and Women

Around two-thirds of men and women were more inclined to consider buying a car with nicer tires over any other potential aftermarket upgrade. Car experts suggest the quality of a car’s tire set can make a world of difference in both the performance and speed of the vehicle, though there are things you should look out for to ensure you aren’t getting taken for a ride when purchasing them.
Men and women had similar perspectives on the value of tinted windows and heavy-duty floor paneling, but men were more likely to be swayed to a purchase by an upgraded speaker system than women. However, men said cars with fancy rims were more a vehicular turn off to them than to women. In fact, over a third of men would be less likely to consider buying a car that had obnoxious rims on it, while over 29 percent of women said the same.
How the Generations See Car Upgrades

Baby boomers and millennials may have different priorities on many issues, and buying a car is no different. While baby boomers account for more than double the number of new car sales over millennials, research indicates more millennials know what they’re looking for before ever showing up on the lot. As with buying new cars, the generations had different perspectives on what counted as cool when it came to aftermarket upgrades.
Our survey revealed around 72 percent of baby boomers and millennials liked nicer aftermarket tires, compared to roughly two-thirds of Gen Xers. While baby boomers had the highest positive perception of stainless steel brake lines, millennials were more entranced by upgraded speaker systems than any other generation.
The most obnoxious upgrades according to the generations? For baby boomers, it was the idea of bigger tires than the standard dealer size. And fancy rims were the most unsightly upgrades according to nearly 41 percent of Gen Xers and around 46 percent of millennials.
The Appeal of Aftermarket Upgrades

So what will sway a younger buyer to consider an upgraded car compared to someone older?
Across all three generations, the unanimous answer was nicer tires. Upgrading a vehicle’s tires can be costly, and coming across a set preinstalled made roughly two-thirds of people more interested in buying the car, regardless of their age. Tinted windows – which don’t just keep your car cooler, but also protect internal elements like the dashboard and provide an additional layer of privacy for your vehicle – made over 40 percent of people of every generation more interested in potentially purchasing a new vehicle.
Not all upgrades are going to attract every type of buyer, though, and racing seats are at the top of that list. A third or more of every generation said they’d be less interested in buying a car that came with racing seats, followed by larger tires and over-the-top rims.
Protecting Your Investment for Miles
Whether you’re looking to upgrade your current ride or are in the market for a new one, some modifications can hurt your car’s perception and resale value. Upgrades like fancy rims and racing seats may seem appealing at the moment, but if you ever try to sell your car with these enhancements, you may discover finding a buyer is harder than anticipated.
If you intend to keep your car for the average six-year span (or longer), keep it protected. That also means having the best auto insurance possible to keep you, your vehicle, and your family safe from unexpected accidents. At CheapCarInsurance, our job is to find the best coverage at the lowest rate possible. We let you compare coverage options from local and national providers in your area, so you make the best decision without compromising on coverage. Visit us online at CheapCarInsurance.net to learn more and take advantage of our free quote comparison tool today.
Methodology
We surveyed 1,017 Americans about their opinions on a variety of aftermarket car modifications, as well as whether they were more likely to purchase a vehicle that had each modification.
Fair Use Statement
In a race to share our content for noncommercial purposes? We promise to perceive that as cool and not obnoxious; all we ask is that you link your readers back to this page. If you have media inquiries, please reach us here.

The average American driver uses over 650 gallons of gas every year. At roughly $2.46 per gallon, that’s nearly $1,600 just to fill up your tank on an annual basis.
Other ways of filling up your car might be costing you, though, and these prices aren’t posted on the signs at the station.
Gas station inspections – which usually leave behind stickers like these – are meant to ensure gas stations and their pumps aren’t violating laws that could end up costing unsuspecting motorists over time. We studied 2016 inspections across multiple states to learn how many stations earned violations for water and sediment mixed into their gasoline to faulty hoses and leaky pumps. Want to know the odds of filling your car with more than just gas the next time you’re at the pump? Keep reading to see what we discovered.
Failings at the Fuel Pump in Georgia

Of the thousands of gas station violations recorded across the U.S. in 2016, more than 1 in 5 involved water. This isn’t the water provided so you can wipe your windshield or the accessible water hoses in case of an emergency, but water found mixed in with the gasoline dispensed directly from the pump.
A driver might not even realize this violation right away, but some common symptoms involve sputtering and decreased performance while trying to accelerate. The damage from water seeping into your gas tank can be costly, and stations that have been identified as responsible for these violations in the past have occasionally denied paying to have their customer’s cars repaired.
More than 1 in 10 violations also involved broken displays at the pumps, cracked hoses, and leaks. If a gas station pump housing or display looks tampered with in any capacity, it’s possible the device could have been illegally modified. These reprehensible revisions have been occurring at an alarming rate over the years.
Leaking Into the Georgia Landscape

Leaky hoses and pumps at the gas station aren’t just a nuisance when gasoline leaks onto your clothes or shoes – they can have an intensely adverse effect on the environment and communities where those leaks occur.
In Barrington, Illinois, a Mobil gas station was ordered to pay $20,000 in fines for environmental damages caused by a gas leak that contaminated soil and groundwater and even caused vapors to enter surrounding homes. A study by the Johns Hopkins Bloomberg School of Public Health found even the smallest spills at service stations can cause significant contamination of soil and groundwater.
According to pump violations reported in 2016 across Georgia, more than 1 in 10 violations involved faulty discharge, and nearly a third of all pump leaks occurred with regular-grade gasoline.
Incidents of Infractions in Florida

In some states, a gas station might only be inspected once every two years to check for pump violations. Among other things, the inspection can reveal how many times a pump was locked, failed to dispense the right amount, or even dispensed too much gas compared to what was charged.
Throughout 2016, more than 11 percent of gas station inspections reported in Florida occurred in March. The following month saw nearly half as many inspections, accounting for more than 6 percent of the year’s total. Gas station violations seem to vary over the course of the year, which may indicate a surge of inspection activity rather than a seasonal shift in violation prevalence. Among noted infractions is the failure rate of gas pumps, almost 7 percent of which were reported in May and August.
While these inspections are often unannounced, inspectors have the ability to close gas station pumps if their variances exceed certain perimeters. In some instances, inspections can reveal more than sub-par gas quality or pumps that overcharge. In 2015, a three-month inspection across Florida of over 7,500 gas pumps found 103 credit card skimmers, which could be stealing customer information as unsuspecting drivers swipe their cards at the pump.
Fraudulent Flow in Florida

The speed of gas dispensing at the pump can directly affect the amount of fuel vapors being sucked back into the nozzle, effectively charging you for gas you’re not receiving.
While nearly 70 percent of the pumps inspected in 2016 in Florida pumped at a normal speed, almost a third of pumps pumped too slowly, and more than 1 in 10 failed their inspections.
According to these inspections, nearly 95 percent of plus-rated pumps flowed at a slow speed. Regular- and premium-leaded gas followed normal speeds more than 97 percent of the time. While you’ll eventually get the gas you need, you could find yourself waiting for what feel likes forever when you’re fueling up.
North Carolina’s Tainted Tanks

Sediment that enters your car this way can settle at the bottom of the gas tank, and its adverse effects can be exacerbated by letting gas levels run low, resulting in damage to internal parts of the car’s engine.
More than 20 percent of North Carolina’s gas station violations also involved water, which was most commonly found in diesel fuel. Water and particles in diesel cause the significant internal damage to a diesel engine fuel system. Symptoms of this damage can include increased fuel consumption, smoke, noise, and poor starting. It’s important to note that violations examined for this project includes all condemnations, lab and field. Field inspections are most often condemned by a tank sample, not the dispenser which usually meets specifications. Tanks samples are a proactive measure that often stops the condemned product every reaching the customer.
Gas Tank Trespassers in North Carolina

Over the course of 2016, water violations at gas pumps in North Carolina most often occurred during rainy months like August, September, and October (peaking in September), and over the springtime months of April and May. Inadequate filtration systems can lead to water seeping into gas pumps, causing engine sputtering and trouble accelerating to higher speeds.
Sediment violations were less likely to be recorded during rainy months, and gas stations had the lowest number of occurrences in September and June. However, while water violations were less common in January and February, sediment infractions were highest during these early winter months.
Cut the Costs
As if gasoline didn’t cost enough, there are plenty of ways you could be overpaying at the pump without even realizing it. Water and other debris could secretly seep into gas reserves, infecting your car and damaging your engine, not to mention fraudulent skimmers and even leaky pumps.
Considering the way gas may be stacked against you, let CheapCarInsurance make sure you aren’t overpaying for coverage. Driving a car in the U.S. is a costly experience, and car insurance tops the list of expenses outside of car payments. We provide cheap comparison quotes that are free and customized, so you get exactly what you need at a price that works for you. Visit us online at CheapCarInsurance.net today to learn more.
Methodology
We contacted the departments responsible for inspecting gas stations in a handful of states to find out the types of violations that were the most common.
Due to the differences in reporting and inspection protocols, each state’s data is noncomparable to other states. We analyzed various areas of gas station inspections based on the strengths of each state’s inspections.
Data from Georgia were used to analyze leaks and violation prevalence overall. Gas station inspection data from Florida were used when looking at the percentage of inspections and violations over time, as well as the failure rates and flow speeds at pumps. Gas station inspection and condemnation data in North Carolina were used to analyze the presence of water and sediment during inspections.
Sources
- https://www.fool.com/investing/2017/01/14/heres-how-much-gasoline-the-average-american-consu.aspx
- https://www.tn.gov/agriculture/topic/ag-businesses-fuel
- https://www.bellperformance.com/blog/water-in-gas-tank-symptoms
- https://consumerist.com/2014/05/15/should-gas-station-pay-for-damage-from-pumping-water-into-customers-car/
- http://jalopnik.com/how-to-protect-yourself-from-gas-pump-credit-card-skimm-1743734892
- http://www.nbcwashington.com/news/local/Keeping-Gas-Pumps-Honest-140666363.html
- http://www.myajc.com/news/state–regional-govt–politics/pay-the-pump-inspectors-try-keep-stations-honest/S3bu9b0glux4OjDCTV0uGJ/
- http://www.orlandosentinel.com/business/os-gas-pump-skimmers-20150519-story.html
- http://www.knowyourparts.com/technical-resources/fuel-system/bad-fuel-fact-or-fiction/
- http://www.axi-international.com/resource-center/diesel-101/the-effects-of-diesel-fuel-contamination/
- http://www.wesh.com/article/what-is-the-central-florida-rainy-season/4441900
- http://www.chicagotribune.com/suburbs/barrington/news/ct-bcr-gas-station-leak-tl-0804-20160802-story.html
- http://www.baltimoresun.com/health/bs-hs-gasoline-drips-20141031-story.html
- http://www.nvroofs.com/save-money-at-the-gas-station-efficiency-at-the-pump/
- https://www.forbes.com/sites/tombarlow/2011/04/25/your-cost-to-drive-is-higher-than-you-think/#89d8fd84383c
- https://www.eia.gov/outlooks/steo/
Fair Use Statement
Are you as concerned about the money Americans are spending at the pump as we are? We’d love to see our article showcased on your website for any noncommercial purposes, but please ensure a link back to this page so our contributors earn credit for their work.

Car technology and safety features have come a long way. While major tech companies are currently racing to produce the first self-driving cars, it wasn’t until 1959 that Volvo debuted the first three-point seat belt that’s standard in vehicles across the country today.
Considering cars are already beginning to park themselves, self-adjust in a lane, and automatically brake when another vehicle gets too close, how important is safety technology in cars today? And how much are people willing to pay for these features? We surveyed 1,000 Americans to learn how much staying safe behind the wheel really matters. Continue reading to learn more.
Safety vs. Tech Features

On a scale of one to five, participants ranked side air bags as the most important car safety feature (an average of 4.18). Side-impact air bags inflate even more quickly than standard frontal air bags and have even been found to protect against injuries that a three-point seat belt can’t.
However, the next most important feature was USB ports (3.69) – a non-safety tech feature ranked higher than other safety elements like blind spot warnings, automatic emergency braking, and reverse rearview cameras.
Cruise control was another convenience drivers ranked as more important than certain safety features, but premium tech upgrades like a heated steering wheel, headrest DVD players, and Apple CarPlay were ranked among the lowest.
Shelling Out for Safety Features
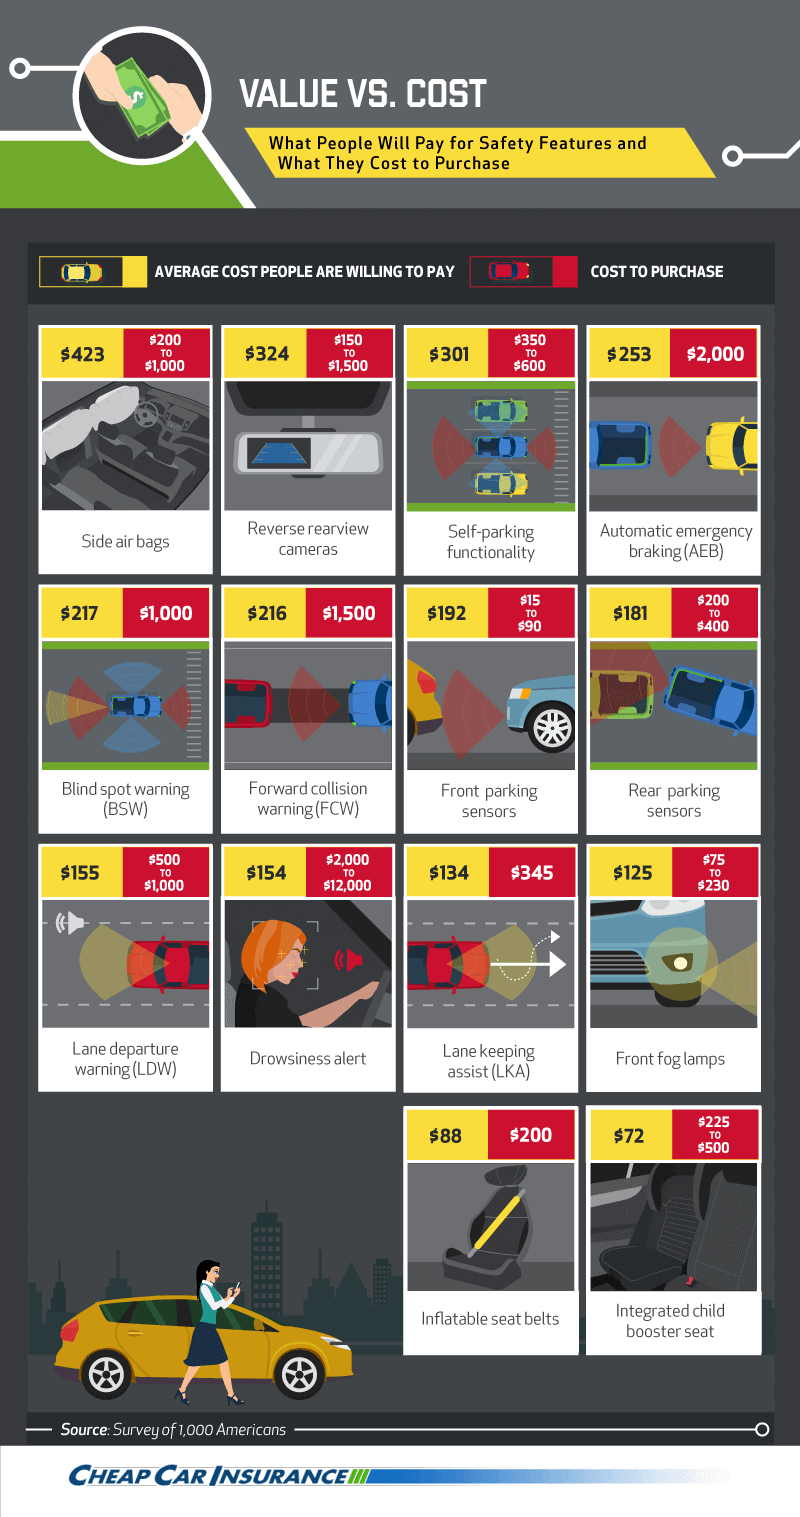
Side air bags were so important to people surveyed that they were willing to pay an additional $423 for this elevated safety option. Despite their willingness to pay over $400, side air bags can cost up to $1,000.
Besides side air bags, only two safety features were worth more than $300 to respondents: reverse rearview cameras and self-parking functionality. Rearview cameras cost anywhere from $150 to $1,500 on average, and the National Highway Traffic Safety Administration (NHTSA) issued a ruling that all new vehicles under 10,000 pounds will be required to include them beginning in May 2018.
Added features like inflatable seat belts and integrated child booster seats were the least valuable to drivers – only worth an additional $88 or less.
The More We Trust A Safety Feature, the More We Pay

Side air bags were ranked as worth the most additional money to people polled and were also the most trusted feature. Despite not being mandatory, most manufacturers include side air bags as standard equipment. Side air bags protecting the head reduce the risk of a driver’s death by more than a third – and in SUVs, by 52 percent.
Both reverse rearview cameras and self-parking functionality were worth more than $300 to those surveyed, but only rearview cameras were ranked nearly a four out of five in trustworthiness. Self-parking functionality was ranked much lower in trust (an average of 2.7). Despite parking cars 10 percent faster and with 37 percent more accuracy, many drivers still don’t trust self-parking systems to take control of the wheel fully.
Safety features like front and rear parking sensors were worth less than $200 to participants but were ranked an average of 3.4 in trust.
Ranking Tech and Safety Features

Depending on the type of car, the most popular safety and tech features varied from driver to driver.
For participants behind the wheel of a sedan, SUV, or minivan, cruise control was the most important tech feature and blind spot warnings were the most important safety feature. While pickup truck drivers were also most interested in cruise control, front fog lamps and automatic emergency braking were the most important safety features.
Regardless of car preference, headrest DVD player screens and Apple CarPlay were the least valuable tech upgrades.
While integrated booster seats and inflatable seat belts were widely considered unnecessary safety features, self-parking functionality was the least important feature to those with minivans or vans.
The Value and Trust of Safety Features

People who drive an Acura were the most likely to rank safety features as the most important. However, BMW drivers ranked their overall trust of their car’s safety features the highest. In general, BMW cars are listed as offering optional advanced safety systems, currently providing options for blind spot monitoring, lane departure warnings, and rollover protection systems, among others.
Kia drivers felt these safety features were the least important, and participants with a Chrysler were the least trusting of their vehicle’s safety features.
Safety Feature Priorities, by Region

Side air bags were considered the most important safety feature in every region.
In the West and Northeast, respondents felt the next most important feature was blind spot warnings. In the West, vehicles of this size are most likely to have major blind spots and are the most likely to benefit from warning systems. Participants in the South, listed reverse rearview cameras as the second most important safety feature.
Automatic emergency braking was another important feature across the country, in addition to rear parking sensors in the West and Northeast.
Trusted Safety Features, by Generation

People of every age trusted side air bags more than any other safety feature.
However, baby boomers were less likely to trust automatic emergency braking than Gen Xers and millennials, and they didn’t list front parking sensors or rear cross-traffic warnings as trusted options at all.
Reverse rearview cameras were listed among the most trusted features by all participants, along with front fog lamps and rear parking sensors.
How Accidents Impact Upgrades

By some estimates, the average driver has an accident nearly every 18 years.
Respondents who were in a car accident were willing to spend nearly $120 more than those who weren’t in a car accident for side air bags. Reverse rearview cameras were also worth more, averaging $50 more to drivers who experienced a vehicle accident, in addition to blind spot warning sensors, which averaged $38 more.
Tech upgrades like self-parking functionality and automatic emergency braking were generally worth more to drivers who were never in a car accident.
How Children Impact the Importance of Safety

Participants who had children rated the importance of side air bags higher than those without, in addition to blind spot warning sensors and automatic emergency braking.
In fact, parents were more likely to rate nearly every available safety feature as more important than those without children.
Only front fog lamps, forward collision warnings, and self-parking functionality were considered more important to drivers without children.
Where to Save and Spend
Across the U.S., certain safety features are regarded as trustworthy and valuable. Side air bags – though not mandated for new vehicles at the time of this writing – were considered the most important and trustworthy safety feature a car could have.
When it comes to premium safety features, just because you’re willing to pay more doesn’t mean you should. The same goes for car insurance. The best in coverage shouldn’t have to cost you an arm and a leg. Even renewing your car insurance without shopping around could be costing you big. Visit us online today at CheapCarInsurance.net to find free, customized comparison quotes to see how much you could be saving.
Methodology
We surveyed 1,000 Americans about their opinions on car safety features.
Fair Use Statement
Want to feature this project about car safety technology on your site for noncommercial purposes? Just be sure to link to this page.
 Hurricane season runs from June through November so it’s smart to prepare during the first part of the year for tropical storms and the damage they might inflict on your cars and homes.
Homeowners insurance is what people are most concerned about ahead of hurricane season, but thought should be places on car insurance, too.
You’ll need both types of coverage.
However, your car insurance policy might not cover any damages caused by a flood or hurricane.
Liability insurance alone won’t cover storm damage to your car
Drivers with comprehensive and collision auto insurance coverage should read their insurance policy documents closely so that they can find out what is covered.
For example, if you have just liability coverage on your vehicle then any damage caused by wind, rain, or falling tree climbs will not be covered. This is because liability coverage alone only protects you from your liabilities if you are involved in an automobile accident.
Even if a person without liability insurance was in an automobile accident during a hurricane his or her vehicle would not be able to be repaired or replaced at the auto insurance company’s expense. It would be up to the car’s owner to cover the expense.
When water gets into a vehicle and submerges it, it is often unable to be driven. This is because cars have electrical systems and computers that when exposed to a lot of water ends up dying or malfunctioning.
If you have an auto insurance policy that does cover flood damage then you should also look into what your deductible is so you’ll be prepared. That means having this amount of money in your checking or savings account set aside for an emergency.
You stock with water and canned goods for the storm so you will need to stock up with money to deal with any aftermath that takes place.
What to do if your car is damaged in a hurricane
You should contact your auto insurance company directly if you are unsure on whether or not it covers damage caused by flooding, winds, or falling trees. You should ask for written confirmation and keep it with your auto insurance policy documents so that you have it for future reference.
If you have had damage to your vehicle from a flood, hurricane, or tropical storm then you should:
- Document what happened with time-stamped photographs.
- Leave the vehicle where it is if possible.
- Contact your car insurance company immediately and they will send an insurance claims adjuster.

Whether you’ve placed a witty slogan on the back of your whip or you’re using the rear of your ride as a billboard for political campaigns, bumper stickers help car owners add a layer of expression to their vehicles. Bumper stickers allow drivers to share their humor, successes, and allegiances in the form of adhesive statements.
We surveyed over 2,000 U.S. drivers to understand their thoughts and perceptions of several popular bumper stickers. Are we a nation not only divided by party lines but also by our love or hate of bumper stickers?
What Your Bumper Sticker Really Says

Almost every bumper sticker agitates another driver. If you want to be seen as ignorant by fellow motorists, there are two types of bumper stickers that will give off this vibe: the Confederate flag and a Trump/Pence political sticker. Around 34 percent felt the Confederate flag showed an uneducated opinion, while 28 percent were seen as ignorant for their display of a Trump/Pence sticker.
When it came to drivers who were annoying or obnoxious due to their bumper sticker choice, only those who displayed a “Support Our Troops” sticker were comparatively free from this scrutiny. But drivers who viewed a pro-gun, coexist, and parent of an honor roll child bumper stickers saw their fellow motorists as the most annoying or obnoxious (nearly 21 percent).
Marathon runners – who think taking a 26.2-mile trip by foot is as good as taking a ride in their car – were viewed as totally normal or reasonable by 34 percent of those surveyed.
Lastly, proud parent bumper stickers were perceived as an expression of pride. Bumper stickers sharing the car’s operator may be the parent of an honor roll student were seen by almost 52 percent as a sticky moment of pride.
Your State’s Favorite Sticker

It’s no surprise states are divided on issues other than politics. In this case, bumper stickers! While in Florida, Georgia, Wisconsin, Ohio, and Michigan, the top bumper sticker plastered to cars were related to family, other states – like those near or within the tri-state area and Washington – possessed more college-related stickers. Because the choice of sticker tends to be an expression of opinion and pride, we can infer residents from each state had their own state-specific things to be proud about.
Interestingly, California was one of only three states to prefer bumper stickers expressing political beliefs – possibly even tied with talk of residents in California petitioning to secede from the U.S. Who would have thought state regionalism could be so transparent?
From Sea to Shining Bumper

Nowhere in the U.S. were bumper stickers more prevalent than in the South. In fact, bumper stickers may be a way of life in Alabama, Kentucky, Louisiana, Mississippi, and Tennessee. Sixty-eight percent of respondents from these states, or over two out of every three, had at least one bumper sticker. Respondents from Delaware to Florida also loved bumper stickers, with at least 63 percent having at least one.
Those in the West and Great Lakes region, however, did not completely agree with their Southern counterparts when it came to favoring bumper stickers, as only about 50 percent had at least one bumper sticker on their vehicle.
Interestingly, women were overwhelming more likely to have a bumper sticker on their car – 63 percent compared to 50 percent of men.
Sporty Bumpers

According to survey respondents, the most popular bumper stickers were related to sports, fitness, or leisure activities (just over 17 percent). These are probably marathoners (or half-marathoners), anglers, CrossFit athletes, or other active individuals “who would rather be surfing” than commuting to their 9-to-5 jobs.
Politics came in second overall, with many drivers unafraid to use their freedom of speech on public highways. College pride rounded out the top three. Who doesn’t want to share some school spirit when they’re en route to the game or heading back to campus for homecoming or Parent’s Weekend?
50 States of Stickers

When it came to those advertising their love of CrossFit or their ability to complete long-distance races, those living on the Atlantic seaboard from Delaware to Florida didn’t miss a moment to shine. Over 13 percent of participants in this region had bumper stickers focused on sports, fitness, and leisure activities. These could also be people sharing their pride for their favorite sports teams, such as last year’s Super Bowl runner-up, the Atlanta Falcons.
Those who wanted a little more humor in their bumper stickers resided in the heart of Texas and surrounding states. While you may not want to mess with Texas, it’s clear Texan drivers don’t mind a bit of “hee-haw” in their bumper sticker’s messaging. Those taking life a little more serious were all across the Atlantic Coast, as far up as New York.
Bumper Battlegrounds

While their bumper stickers didn’t need to be political in nature, over 82 percent of drivers affiliated with the Green Party drove around with some sticker on their bumper. While they might be advocating for a candidate, there are several issues the Green Party is currently concerned about, which could provide inspiration for their bumper stickers. These topics include free child care, environmental defense, and tuition-free higher education.
Republicans were more often found with bumper stickers than Democrats. Over 61 percent of drivers who identified as Republican – compared to 56 percent who were Democrat – had a bumper sticker on their vehicle. Independents were least likely to have a bumper sticker on their car.
Sharing an Important Choice

In 2016, 56 percent of Americans believed “abortion should be legal in all or most cases.” But that doesn’t stop the pro-choice and pro-life debate from raging on across the U.S. One way the conversation continues? Bumper stickers.
With close to 60 percent of Republicans believing abortion should be illegal in most cases, 37 percent found pro-choice bumper stickers to be annoying or obnoxious. However, Democrats often viewed those displaying a pro-life bumper sticker as ignorant (32 percent) and annoying or obnoxious (30 percent).
Libertarians or Independents seemed to share similar feelings about bumper stickers on both sides of the issue. Regarding pro-life stickers, 32 percent of Libertarians and 31 percent of Independents found them to be annoying or obnoxious, and 17 percent each felt they were signs of ignorance. When looking at those with a pro-choice bumper sticker, 30 percent of Independents and 35 percent of Libertarians thought they were also obnoxious.
Stick It to You
Bumper stickers provide a way to personalize one’s car beyond its color and minor cosmetic adjustments. Many people do use bumper stickers, and they’re generally tolerant of others who choose to do the same. While we’re most likely to catch a sports-themed sticker flying by on the rear of the car in front of us, we shouldn’t be surprised by politically inspired or school-specific stickers on the road.
For more information on navigating the highways – and how to do so with the best car insurance rates – head to CheapCarInsurance.net to find ways to save hundreds annually on your policy. Think about how many bumper stickers you could buy!
Methodology
We surveyed more than 2,039 U.S. drivers about their thoughts and perceptions related to a series of different types of bumper stickers.
Sources
https://www.greenparty.org/Platform.php
http://www.politico.com/story/2016/11/clinton-lead-popular-vote-2016-231790
http://www.pewresearch.org/fact-tank/2016/04/08/on-abortion-persistent-divides-between-and-within-the-two-parties-2/
http://www.statisticbrain.com/marathon-running-statistics/
Fair Use Statement
Feel free to take these images and plaster them all over your rides, or websites, for noncommercial purposes. But do the right thing and link back to this page so the drivers (the authors) get credit.

If you had to rate your driving skills on a scale of 1 to 10, what number would you give yourself? Do you follow every rule of the road? Are driving below the speed limit and stopping at red lights non-negotiable? A lot of people would consider themselves to be pretty safe drivers, but according to a survey conducted by AAA, around 87 percent of people partake in some unsafe behaviors while driving.
Whether it’s texting on the phone or speeding through a school zone, there are a multitude of risky driving habits we usually end up paying for. In a 2011 survey, the Bureau of Justice Statistics reported about 42 percent of civilian-to-officer contact occurred due to traffic stops. Of that 42 percent, half received a traffic ticket. But what if you couldn’t get a ticket for your dicey driving habits? If the laws as we know them didn’t exist, would you still drive the same way? We surveyed 2,028 Americans to find out how their driving habits would change if there were no consequences for their actions. Keep your hands on the wheel to see what we discovered.
Hit-and-Run Hot Spots

If you’ve ever been a victim of a hit-and-run, you know they are incredibly frustrating. Unless you’ve got the best policy and know insurance like the back of your hand, it’s likely you’ll face higher costs if you get into an accident with a person who takes off. Hit-and-run fatalities have been on the rise since 2009, and if every traffic law disappeared overnight, it would probably be a good idea to stay out of these states.
If you were in an accident in South Carolina or Kansas and there were no traffic laws, over 30 percent of drivers would flee the scene. Louisiana, Rhode Island, and Nebraska don’t fare too well either – around a quarter of residents would not cooperate in an accident. Luckily, Kentucky and Arizona possess a relatively sound moral compass, with less than 5 percent of respondents saying they would leave the scene of an accident if they weren’t required by law to stop.
Foregoing Car Insurance

Would you still have car insurance if you weren’t required by law to do so? It turns out, most participants would carry insurance on their vehicle even if it wasn’t against the law to waive coverage. The cost of an accident is a lot more than the cost of having insurance. In 2013, the average liability claim for bodily injury was over $15,000 as opposed to the average cost of insurance being a little under $1,000 a year.
Having auto insurance gives you peace of mind in “what if” situations. Even though there would be no chance of receiving a ticket, the majority of respondents agree it just isn’t worth not having. Men between the ages of 25 and 34 proved to be the most daring, with around 28 percent saying they would skip the insurance premium if the law books vanished overnight.
Smoking Weed Behind the Wheel

Next, participants were asked if they would smoke marijuana while driving if traffic laws did not exist. Broken down by age, less than 30 percent of respondents aged 18 to 24 and 25 to 34 would drive under the influence of marijuana if there were no legal consequences. Each subsequent age group responded “Yes” with less frequency, though, with fewer than 3 percent of those aged 65 to 74 willing to light up.
However, percentages were relatively low across each age group, indicating participants may already know the dangers of driving under the influence of marijuana. According to the National Institute on Drug Abuse, marijuana can impair drivers’ coordination and judgment, as well as their reaction time. People involved in vehicle crashes with THC in their system are three to seven times more likely to be responsible for the accident than those who don’t have it in their system.
Alcohol In The Automobile

Even though drinking and driving accounts for almost a third of traffic-related deaths in the U.S., some people would drink and drive if they knew they wouldn’t get pulled over. Nearly 23 percent of participants between the ages of 25 and 34 said they would drink and drive. Perhaps they’re unaware of the fact that someone is injured in a drunk driving incident every two minutes.
Acceptable Alcohol Levels

The worst part about going out to drink may be figuring out who is going to drive home. Thankfully, there’s enough information available today to convince people drinking and driving is dangerous. It could cost you thousands of dollars, your car, and even someone’s life.
The standard chart for determining BAC levels shows that, depending on the person’s size and gender, the majority of people can handle between two and four alcoholic beverages before reaching the national blood alcohol limit of .08. Most people (about 64 percent of men and nearly 65 percent of women) thought this was a reasonable limit. For detractors, however, women seemed to want the rules to be a bit stricter, while men wanted the freedom to drink a couple more glasses before getting behind the wheel. In both cases, less than 1 percent of those surveyed thought these laws should be abolished altogether, although it might be worth mentioning about twice as many men as women found this idea appealing.
Setting the Speed Limit

How often do you speed on the highway? Nearly half of drivers have sped on the highway before, and 1 in 4 think it’s OK to do so, according to an AAA report. We asked participants what they thought the speed limit on the highway should be. Most people were fine with keeping the highway speed limit as it is – or no faster than 70 mph – which is a common speed limit on rural interstates across the U.S.
By age, those 25 to 34 most believed highway speed limits were unnecessary altogether. No survey respondents over the age of 54 shared this belief, though. Over half of those aged 65 or older believed current traffic laws worked just fine, compared to just 30 percent of respondents between the ages of 25 and 34.
Seatbelt Sentiment

It’s common knowledge you’re much more likely to sustain a fatal injury in a car accident if you’re not strapped in. A CDC study found more than half of teens and adults aged 20 to 44 who died in crashes in 2014 were not wearing a seat belt. Does information like this affect public opinion toward seat belt laws? We asked participants if they believed these restraints should be optional.
When considering the top 10 states with the highest percentage of people who would make seat belts optional, over 58 percent of respondents in New Hampshire, the only state without mandatory safety belt laws, believed seat belts should not be required. Half of the participants in Rhode Island and Nebraska also believed the same. North Dakota, Oklahoma, New Mexico, and South Carolina – all states with around a third of residents who felt seat belts should be optional – also appeared on The Huffington Post’s top 10 list for the most dangerous states to drive in.
Keeping to the Rules
A vast majority of participants would choose to follow the law even if there weren’t consequences. Our safety is important, and following the rules put in place makes it easier to live another day.
Sometimes, a text or phone call may distract us, but it shouldn’t be intentional or continuous. Driving unsafe not only can cause harm to you, someone else, or your vehicle but also can make your car insurance skyrocket. At CheapCarInsurance.net, we have tons of information on how to keep your insurance rates low and affordable, without the risk of being caught.
Methodology
We surveyed 2,028 American drivers 18 and older. Survey participants were asked how they would drive if there were no traffic laws or no chance of being penalized for their actions. They were also asked how they would structure the laws if given the opportunity. Using this data, we visualized the responses and segmented it by demographics.
Fair Use Statement
You won’t get a ticket for sharing this content for noncommercial purposes. In fact, we encourage it! However, please be sure to steer your readers back to this page by linking back to the original content and giving the authors proper credit.

It could be a couple of glasses of wine at dinner, a few beers catching up with friends, or a bartender with a heavy pour before your speech becomes slurred, your short-term memory suffers, and your reaction time slows. It could slow just enough to miss hitting the brakes by a fraction of a second. Crash.
Every day in the United States, 28 people die in a car crash that involves an alcohol-impaired driver, according to the National Highway Traffic Safety Administration. That is one person every 53 minutes, 196 people a week, roughly 840 people a month, and possibly over 10,000 people a year.
The legal alcohol limit in most states, 0.08 percent blood alcohol content (BAC), can be reached in as little as three alcoholic beverages for some people, according to this chart. However, the Centers for Disease Control and Prevention says that it takes an average of four drinks to arrive at a 0.08 percent.
To be clear, we’re not talking about four mixed drinks all downed while dancing in a nightclub for an hour. We’re going to show you how the estimated numbers play out by age and gender based on survey results of over 1,000 people. Who admits to driving drunk? Who says they would do it again? Who is most likely to call for a ride? Who would let a friend drive drunk? Would you?

When the weekend comes along, it’s time to let loose. This chart breaks down the differences between men’s and women’s BAC levels on the weekends and during the week, and by age.
Though men indulge more than women both during the week and on the weekends, both genders see an uptick in alcohol consumption on Saturday and Sunday. Both men’s and women’s BAC levels nearly double come week’s end.
Men go from a BAC level of about 0.015 percent to about 0.043 percent on the weekends, which is more than double that of the week’s BAC levels. Women, on the other hand, start with a slightly lower BAC during the week, at around a 0.014 percent, and increase to about 0.038 percent. Again, the weekend average BAC level is more than double that of the week’s average, but women are showing a trend of consuming less alcohol overall.
When looking at the breakdown by age, of the 1,000 surveyed, people in their early- to mid-20s tended to have the highest BAC levels on the weekends, as indicated by the number of red circles above the 0.08 percent line. The number over the legal limit begins to taper off dramatically around the mid-30s.
According to the NHTSA, drivers aged 21 to 34 accounted for 59 percent of total drunk drivers in 2014 overall. This statistic falls in line with the graph above, stating that weekend BAC levels tend to be highest in those in that age range. After age 34, weekend BAC levels above the legal limit tend to be more of a rarity.

A glance at this chart will show that men tend to think they have the upper hand where alcohol consumption is concerned. Though the CDC sites that, on average, four drinks is the maximum for most people before a 0.08 percent BAC is present, 0.2 percent of the surveyed men said they felt they could have an astounding 14 drinks in one hour and still drive.
The most drinks women believed they could have before turning over their keys were five, with less than 1 percent citing that number.
However, the most common answer for both men and women was one drink, with more than 50 percent of women saying one drink was acceptable and 23 percent of men agreeing.
More women than men found that the only acceptable amount of drinks one could have within an hour before driving was 0. Though the percentages remain small, with women at just 9.27 percent and men at 4.12 percent, nearly twice the number of women responded with the answer 0 than men.

Here’s how the demographics of the previous graph shake out. Age definitely appears to be a factor in drinking and driving, as 12 percent of millennials said they believed they could drink more than the legal limit and still drive.
Generation X respondents made up 6 percent of those with answers over the legal limit, and baby boomers accounted for only 3 percent.

Between the genders, more men have driven drunk without regret. According to the chart, 8 percent of men surveyed said that they had driven drunk and didn’t regret it, compared with 4 percent of women who said the same.
However, 50 percent of the men surveyed said they had driven drunk and regretted it, while 46 percent of women agreed.

Nearly half of the people who admitted to driving drunk, 46 percent, said that they drove while under the influence because they believed they wouldn’t be caught. However, the largest portion of people, 74 percent said they drove because they felt they were sober enough.
Not everyone who drove while under the influence of alcohol was trying to get home. A quarter of the people who admitted to driving drunk said they were driving to another place to drink more and 17 percent were driving to a liquor store to buy more alcohol. However, most people, 94 percent, said they were heading home.

There is, of course, another option if you’re out drinking: you can call a ride. This graph breaks down the use of ride-sharing services like Uber or Lyft by gender and BAC.
According to the graph, men are more likely than women to use a ride-share. Roughly 43 percent of men called for a ride, while only 38 percent of women called for one.
Almost 70 percent of men said that they called a ride-share service because a friend made them, while only 30 percent of women reported the same reason. However, 34 percent of women responded that they called a ride-share because they were too drunk to get to their destination, while that was the reason for almost 63 percent of men.

More men reported that they would let a friend drive drunk – to avoid a serious argument – than women. Nearly 20 percent of men surveyed said they would allow their friend to drink and drive, as opposed to 7 percent of women who said they’d let a friend out on the road.
The reasons for allowing a friend to drive drunk may astound you. Of the men and women surveyed, 40 percent said that they would let their friend drive drunk because they knew that he or she had done it previously and been all right. Nearly 30 percent cited that they didn’t think their friend would get caught. Both answers neglect the fact that it is both dangerous and illegal to drive drunk.
However, the overwhelming majority, 67 percent, said they believed the driver was capable of driving and 34 percent stated they did not know their friend was drunk at the time. These two answers can be symptomatic of not understanding how alcohol can affect the body or just how quickly someone can arrive at the legal limit of 0.08 percent – impairing senses and leading to dangerous driving conditions.
In fact, reaching the legal alcohol limit isn’t hard to do, and people often get behind the wheel while intoxicated without knowing the harm it may cause. Thousands of people die in the United States every year due to accidents that involve a drunk driver. Understanding how easy it is to reach the legal BAC limit and having the statistics laid out in front of you can be tools to help you prevent another drunk driving accident. The hope is that you will be able to better inform yourself before getting behind the wheel after drinking.
The only way to sober up is time, and the only way to prevent drunk driving is by not doing it. So next time you’re out drinking, call a ride-share service, call a friend, or keep the drinking to a minimum because you could be saving someone’s life – or your own.
Methodology
We surveyed over 1,000 Americans to ask them about their drinking habits and when they would feel OK driving. We provided the following definition from the CDC as the standard number of drinks: “A standard drink is 14 grams of pure alcohol. That translates to 12 ounces of beer, 8 ounces of malt liquor, 5 ounces of wine, or 1.5 ounces (one shot) of distilled spirits or liquor, e.g. gin, rum, vodka, or whiskey.” Then we asked respondents to provide their height, weight, and gender.
From there, we calculated each respondent’s estimated BACs with the Widmark Formula, using the number of standard drinks they estimated being OK with having in different situations. Respondents self-identified as drunk in any situation in which they were asked about driving drunk.
Weeknight BACs were calculated assuming drinks were consumed over a two-hour period, while weekend BACs were calculated assuming drinks were consumed over a three-hour period.
Fair Use
See the value of sharing info found in this project? Feel free to share this project for noncommercial purposes. When doing so, we ask that you please link back to Cheap Car Insurance and this page to give your readers a chance to explore our full report and the data behind it.
Car thieves are getting more sophisticated all the time, and with good reason. The lure of a quick, but highly illegal pay day, has triggered a crime way in stolen wheels in recent years.
According to the FBI, a motor vehicle is stolen in the United States every 44 seconds. In its most recent review on the topic, the FBI reports that 707,758 motor vehicles were reported stolen in the United States in 2015, up 3.1 percent from 2014, according to the FBI.
Not all states are created equal, though. Washington, California and Nevada are the top states for car theft. Maine, New Hampshire and Vermont see the fewest thefts.
How can you avoid being a statistic? By and large, the answer lies in both being aware, and taking aggressive steps to thwart auto thieves before they can roll away with your wheels.
5 Tips to Keep Your Car Safe
1. Hide your key. Auto thieves are becoming more and more sophisticated in plying their trade. Take, for example, the recent trend of criminals using so-called “scanner boxes” to pop a vehicle’s electronic lock in 10 seconds or less.
According to the National Insurance Crime Bureau, scanners leverage the technology used for keyless auto entry, which enable car and truck owners ‘one-click access’ to their auto.
“Our law enforcement partners tell us they are seeing this type of criminal activity and have recovered some of the illegal devices,” Joe Wehrle, NICB’s president, said in a statement. “And unfortunately, some of these devices are available on the internet.”
Fight back against scanner boxes by parking your vehicle in a locked garage, or store your keys in a metal box, or hide them in a wallet or key-holder unit, like the Fob Guard pouch or wallets from Silent Pocket, which can thwart scanner-box auto thieves.
2. Reduce the odds of theft. Often, auto thieves are drawn to specific vehicles not because of the make and model, but by what’s inside the auto.
“I highly recommend not leaving items in plain view inside your vehicle and a security sticker that alerts would-be thieves to an alarm system you have or pretend to have can help prevent some thefts,” says James Johnson, founder and attorney at Johnson Attorneys Group in Newport Beach, California. “Park in a well-lit area or busy area where there is lots of traffic and avoid high crime neighborhoods if possible. If someone wants your car, they are going to steal it. Make sure you have good insurance to protect you if all else fails or you risk losing one of your biggest investments.”
3. Etch your VIN. Korey Adekoya, an analyst at Shabana Motors, in Houston, says that for an extra layer or protection, consider etching your VIN onto each of the windows and doors in your car.
“This means thieves will have to replace those parts if they’re planning on selling off your car and could discourage you as a target.”
4. Leverage technology, for your benefit. Consider placing a tracking device on your car, advises Adekoya.
“This means if it ever goes missing, you will be able to use the GPS system to lead police to the culprit.”
5. Brighten Up. “If a car alarm is activated, on most vehicles that means the lighting activates as well, and the brighter the lights, the better,” states TheAutoPartsWarehouse, in a “tips prevention” statement. “Most modern cars have perimeter lighting built into headlights, taillights, and mirrors to enhance safety and visibility.”
Make sure that all lights are working correctly and if they are cloudy, cracked, or flat-out broken replace them.
How can business owners protect their fleet?
If you’re a business owner with multiple cars and trucks, or even a fleet, you’ve got your work cut out for you against vehicle thieves.
“Cargo thieves are using increasingly sophisticated technology to steal shipments of cargo – even whole trucks,” says Scott Cornell, of the Special Investigators Group Travelers Insurance in New York City. “Use high security locks while cargo is staged. Use security equipment to secure trailers while they are being staged.”
King pin locks and landing gear locks are recommended along with high security locks on the cargo doors. And when tractors are married to trailers, air cuff locks are recommended, Cornell says.
Business owners should communicate consistently with dispatch drivers should maintain communication with dispatch during stops at high-risk areas such as truck stops and rest areas.
“They should inform dispatch of the address of the stop, duration of the stop and how long they will be away from the truck/cargo,” Cornell says. “Drivers should always have their cell phone when away from the load to protect cargo.”
No doubt, auto thieves are using technology to keep a step ahead of law enforcement, and car and truck owners, and show no signs of stopping for any red lights. Use the tips listed above to make that car thief’s job an uphill climb – your vehicle and your auto insurance company will thank you.

It’s easy to say you’re a good driver. Maybe you haven’t received a ticket in a while – or ever. Perhaps you’ve never found yourself on the side of the road calling your insurance company about an automobile accident. Even more, it’s probably been a few days, weeks, months or years since you last took a driver’s education class or flipped through your state’s driver’s handbook. Are you sure you know the rules of the road?
We wanted to see just how well people fared when asked standard questions every driver should know. Did men score better than women? Were older drivers more likely than younger drivers to know the specifics about right-of-ways and lane changes? Take our test and then read on to see how your driving knowledge compares.
Test Your Driving Knowledge
Use our interactive tool to examine your own driving knowledge. After filling in your age, gender, the state and year in which your license was first issued, and the number of accidents you have had, you’ll be presented with 23 driving knowledge questions. As you progress through the test, you’ll be able to see the previous questions you’ve answered correctly, as well as your current score.
When finished, you’ll be presented with a list of the questions you’ve answered – whether right or wrong. You’ll also be able to see your overall score and how it compares to other people with similar demographics. Are you a little rusty on driver IQ, or are you at the top of the class? Find out with our quiz.
Road Smarts Across the Nation

Drivers in the Northeast performed the best on our driving knowledge quiz. Almost 55 percent of drivers in this region passed our driving test. And, overall, 43.5 percent of participants across the nation passed. Further, respondents with licenses issued in the Northwest, Southwest and Central regions managed to pass at an above average rate.
Not all drivers had a mastery of the rules of the road, though. Less than 40 percent of participants from the South and Southeast passed, while Mid-Atlantic drivers were the least likely to know specifics of the driver’s handbook. Only 37 percent managed to receive a passing grade in their state.
Genders in Gear

Contrary to the adage “men are better drivers than women,” female participants achieved a higher average score on our quiz than their male counterparts. Women had an average score of 74 percent, while men received 73 percent. While this isn’t a massive gap, it does mean women have bragging rights.
Female participants also passed our quiz at a higher rate, with 45 percent passing in their respective states. This presented a wider gap when looking at the performances of male participants. Only 42 percent of men who tested their driving knowledge walked away with a passing result.
Experienced Shifters

No age group passed at a higher rate than those aged 60 to 69. This group saw an average score of more than 78 percent and a pass rate of 55 percent. Coming in behind this studious and experienced group of drivers were those 70 and older. While they passed at a lower rate – 50 percent – they did have an average score close to 78 percent.
On the other side of the spectrum, participants younger than 20 years old passed at the lowest rate – below 30 percent. With an average score of less than 70 percent, perhaps this group would benefit from some one-on-one instruction from their parents or grandparents. Hopefully that happens before a broken rule results in an accident!
Behind the Wheel
Are you happy with your score? Are you truly as good of a driver as you thought, or are there some road rules you need to reacquaint yourself with? Even if you know the rules of the road, buckle up with great insurance coverage. CheapCarInsurance.net can help set you up with the appropriate coverage, so you’re protected from people who don’t know the rules of the road. Visit us online to learn more.
Methodology
We compiled and edited a random assortment of driving questions that pertained to the entire country and not a particular location. We created our own version of a written driver’s exam. The initial results of 3,500 tests were then compared to the necessary passing score in the state where their license was issued. The interactive results update with every test taken.
Fair Use Statement
Think your readers have what it takes to pass our driving quiz? We’d love to see our findings featured on your site for noncommercial use. Just please ensure a link back to this page, so your readers can see our research in its entirety.

Ever been pulled over by the police? If so, how did you feel? Did you burst into tears or try to charm your way out of that pricey traffic ticket? Did you get the ticket anyway? What would others do in your shoes?
We wondered just that, so we asked over 2,000 people to tell us about their experiences getting pulled over. Here’s what we learned.
Who’s Getting a Traffic Ticket?

It turns out, getting out of a traffic ticket once the blue and red lights have come on is rare. When we asked our respondents how often they got out of a ticket, most – about 28 percent – said “never,” while over 20 percent indicated rarely. Still, around 19 percent of participants always got out of a ticket.
Who are these lucky people? While men may get more speeding tickets than women, men are also more likely than women to always get out of a traffic ticket (about 20 percent). It may be they’re just more likely to speed, have a busted taillight, or run a red light, or it could be that men drive significantly more than women.
White drivers were most likely to always get out of a traffic ticket (nearly 20 percent), while black drivers were most likely to report never getting out of a ticket (34 percent).
Getting Out of a Traffic Ticket

As the data show, 89 percent of respondents who told police the truth were able to get out of a traffic ticket. Even showing remorse (about 78 percent) was a better tactic than flirting with the police officer (72 percent). No need to work up tears or invent an emergency.
High Emotions at a Traffic Stop

The most common emotion – by a long shot – motorists reported feeling when pulled over was anxiety (50 percent). It may be that the idea of getting a ticket and having to pay it is anxiety-provoking. Or it could be that there is a significant distrust of police (31% of Americans believe the police routinely lie to serve their own interests). The U.S. may just be an overwhelmingly anxious place overall, with anxiety disorders affecting 40 million adults.
Respondents were also mostly scared (almost 25 percent) when they got pulled over.
When segmented by race, white and Asian-American drivers felt the most anxious – 60.5 and 56 percent respectively. However, black drivers were most scared being pulled over (almost 44 percent). This feeling may be related to the fact that unarmed black people are five times more likely to be killed by police than unarmed white people. News coverage of unarmed shootings in recent years has been extensive.
Who’s More Likely to Get Pulled Over?
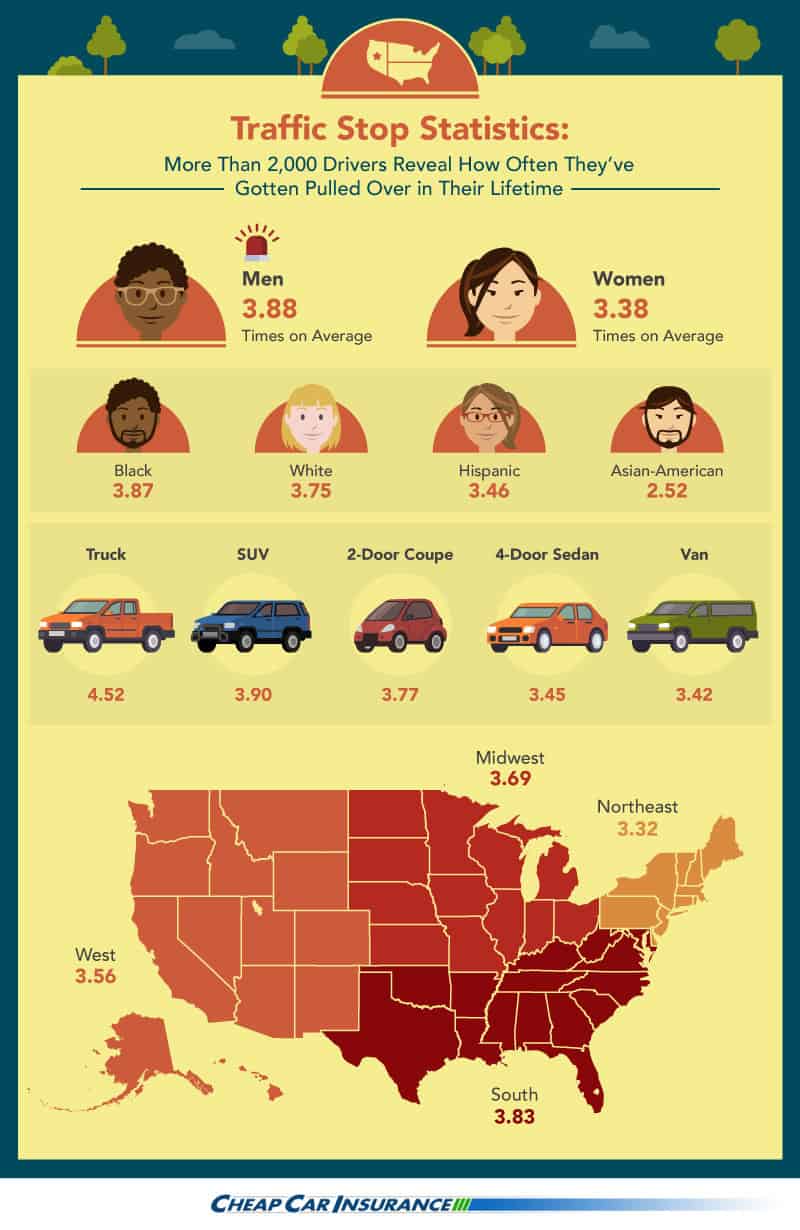
According to the Bureau of Justice Statistics, men are more likely to be stopped than women. Interestingly, our survey results align with this finding, with men more likely to be pulled over on average (3.88 times for every 3.38 times a woman is pulled over).
Type of vehicle and location also seem to matter, with trucks pulled over significantly more often than vans and people in the southeast more likely to be pulled over than people in the northeast.
Guilty as Ticketed

In 2011, roughly 80 percent of people pulled over admitted the police officer had a legitimate reason for stopping them. Of drivers surveyed, black drivers were the less likely than Hispanic or white drivers to believe there was a legitimate reason for stopping them, with just 68 percent calling the traffic stop legitimate.
When asked how often they were guilty of a traffic violation, most of our respondents answered “usually” or “sometimes.”
Black respondents were most likely to respond “never” (with 6 percent saying each traffic stop was unjustified), while Hispanic people were most likely to respond they “rarely” felt at fault when pulled over (nearly 23 percent).
Stay Safe
Many respondents – across race and gender – admitted their previous traffic incidents were legitimate. The best way to keep yourself off the radar and get where you’re going safely and on time? Obey speeding laws, buckle up, and comply with all traffic laws in your area.
Overall, traffic laws are there to keep you safe. Plus, staying away from tickets and accidents can help you keep your car insurance costs low. Who couldn’t use a few extra bucks each month?
Methodology
For this project, we surveyed just over 2,000 Americans to find out about their driving habits and other information surrounding traffic stops.
Sources
http://www.statisticbrain.com/male-and-female-driving-statistics/
http://www.treehugger.com/cars/dudes-youre-driving-too-much-us-men-drive-63-more-women-average.html
https://www.adaa.org/about-adaa/press-room/facts-statistics
http://blogs.reuters.com/great-debate/2015/01/15/one-third-of-americans-believe-police-lie-routinely/
http://mappingpoliceviolence.org/unarmed/
http://www.bjs.gov/index.cfm?ty=tp&tid=702
Fair Use Statement
Keep your readers safe on the road by sharing our content for noncommercial purposes only. All we ask is that our drivers (or authors of this page) are given proper credit.
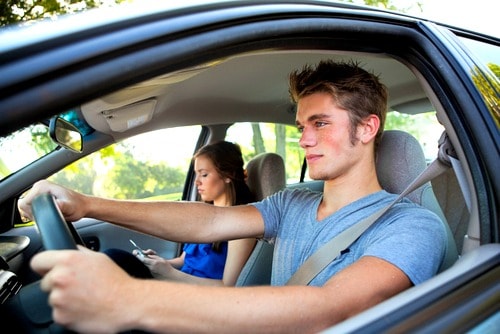 You may look forward to handing the car keys over to your teen, but that convenience will come at a price in the form of higher car insurance rates. These tips to get cheap online quotes can help.
Car insurance for teens can be very expensive, possibly adding hundreds of dollars a month to your premium if you don’t take steps to save money. Online quotes make it easy to shop around for the best deal on car insurance.
Here are six tips for getting cheap online quotes when shopping for car insurance for teens.
1. Get cheap online quotes for a cheap car
One way to save big on car insurance for teens is to buy an inexpensive used car on which you carry only liability insurance, says Derek Benavides, agent and branch owner at Benavides Insurance in Brownsville, Texas.
The Insurance Institute for Highway Safety offers a list of tips for buying your teen a car. It’s safest to choose a larger, heavier car without high horsepower that could tempt a teen to speed. Also, make sure the vehicle has electronic stability control, a safety feature that helps the driver control the car on curvy or slick roads.
MORE: Why Your Teen’s Brain Isn’t Ready to Drive
Getting only liability insurance could cut 65 percent off the amount you’d pay to get liability, collision and comprehensive car insurance for teens.
“A lot of parents make the mistake of buying their kid a brand new car and financing it,” Benavides says. In that case, the lender will require full coverage on the vehicle. “If you have full coverage on a 16-year-old driver, that premium is going to be expensive.”
2. Go online first to get a car insurance quote for your teen
You have two different options to get car insurance for your teen: buy your child their own auto policy, or add them to yours. In most cases, you’ll get cheaper quotes by adding your teen driver to your existing policy.
That’s partly because you’re probably eligible for a variety of auto insurance discounts – for example, for owning a home, having multiple cars, having good credit or being married.
If your teen gets a separate policy, he or she won’t benefit from those price breaks.
3. Price a separate insurance policy online for your teen driver
There are a few exceptions to the rule that it’s generally cheaper to add your teen to your existing car insurance policy. First, you may want to get quotes for a separate policy if your teen has a bad driving record that includes multiple tickets or a DUI.
Secondly, it may make sense to price a separate policy for your teen if you own a sports car or luxury vehicle. In that case, insuring your teen on your policy could be pricy.
However, Benavides points out that if your teen has a separate vehicle – for example, there are three drivers in the household and three vehicles – the insurer should allow you to “assign” the teen to the vehicle he or she drives the most.
4. Search for online discounts that apply to teen drivers
Price breaks for young drivers vary by insurer, so when you get online quotes from different agents or companies, ask what discounts are available regarding car insurance for teens. For example, you may get a good student discount, which could cut your premium by as much as 15 percent, if your teen makes As or Bs in school.
You may be able to get a defensive driver discount if your child takes a teen driving safety class in person or online. Once your child goes off to college, you may be able to get a distant student discount, which could save you up to 35 percent, if he or she is studying more than 100 miles away from home.
“It pays to explore discounts,” Benavides says.
5. Check for cheap online quotes with higher deductibles
To lower the cost of car insurance for teens, consider setting a higher deductible. Get online quotes to see how much you could save on premiums by raising your deductible from $200 to $500 or from $500 to $1,000.
One option is to have your teen save that amount in a car fund to pay the deductible if he or she has an accident. This may teach responsibility, encourage safe driving and ensure the parents won’t be on the hook for paying the higher deductible if the teen has an accident.
6. Clean driving records keep quotes cheaper for teens
Have a talk with your teen about the importance of avoiding accidents and violations like speeding.
If your teen does have a mishap, talk to your agent when looking for car insurance for teens to see if it makes sense to file a claim or if you should consider covering the cost of damages out of pocket, Benavides recommends.
“Avoiding accidents and tickets is a huge deal when adding a teen to your policy,” he says.

Every day, Americans take 1.1 billion road trips in the U.S. That’s four vehicular expeditions for every person in the country.
One of the most instinctual actions when we sit down in our cars should be to buckle our seat belts. We’re taught at a young age that buckling up is as important as looking both ways before crossing the street. But how many Americans actually adhere to this life-saving law?
We surveyed 2,000 people to find out how often they use a seat belt and when they think it’s OK to pass on clicking it. We also asked respondents about their thoughts on seat belts being mandatory. We combined our data with the Centers for Disease Control and Prevention’s (CDC) Behavioral Risk Factor Surveillance System (BRFSS) survey to learn more. Read on to see what we uncovered.
Buckled Up Union

Despite well-documented evidence that supports the life-saving advantages of wearing a seat belt in the car, there are still some people who don’t really feel it’s necessary. Unfortunately, this simple decision can have dire consequences.
Of the more than 35,000 motor vehicle fatalities in the U.S. last year, nearly half of those in passenger vehicles (excluding motorcycles) weren’t wearing a seat belt. The good news is that national campaigns like Click It or Ticket have brought powerful awareness to the importance of seat belts – and the ramifications of not wearing them.
According to the data, about 94 percent of Americans responded that they either always or nearly always wear their seat belt in the car. They found that respondents in California, Washington, and Oregon had the highest percentage of seat belt usage, while New Hampshire, South Dakota, and Nebraska had the lowest. New Hampshire is the only state in the country that doesn’t require passengers in the front seat to wear a seat belt while a car is in motion.
Seat Belt Safety Across All Ages

Of those surveyed by the CDC, millennials between 18 and 34 years old were the least likely to strap in. They had the highest percentage of “sometimes,” “seldom,” or “never” wearing their seat belts in the car. Unfortunately, drivers between the ages of 15 and 19 are most likely to be distracted while driving and (including those between the ages of 20 and 44) to be unrestrained in fatal accidents.
However, an overwhelming percentage of those surveyed responded that they “always” wear their seat belts. The highest positive responses came from Asian-Americans and Hispanics. At the same time, Native Americans were the least likely (almost 81 percent) to “always” wear their seat belts. Tribal reservations set their own laws for safety belts, independently of states, and there can be tremendous variation between them. These laws only apply to registered tribe members living on or conducting business on the reservation and unfortunately, some reservations have no seat belt laws at all.
Permission to Buckle Up

Despite a high percentage of survey takers acknowledging that they never drive or ride in the car without a seat belt, under 75 percent of our respondents agreed it should be mandated by law. While fewer than 2 percent of nearly every demographic polled (with the exception of Native Americans) said they never wear their safety belt, over 28 percent of men and nearly 22 percent of women told us they should be able to decide if they want to wear a seat belt. Gen Xers (27.7 percent) most favored this personal choice as well.
In 1984, New York enacted the first seat belt law in the U.S. By 1996, every state (except New Hampshire) had a mandatory seat belt use law. Since these laws were introduced, annual motor fatalities have declined significantly. Vehicle occupant deaths in 2014 were the lowest in over 20 years.
Regional Seat Belt Opinions

We found that the Midwest (30.3 percent) was most in favor of seat belts being a personal choice and not something that should be mandated by law. According to the National Highway Traffic Safety Administration, occupants who live in rural areas and drive pickup trucks are the least likely to wear safety belts. Perhaps residents in Midwest states, where agriculture makes up a significant part of the economy and there is generally less traffic congestion, fail to see the importance of wearing seat belts because there may be fewer people on the road.
Those in the Northeast and West had the highest positive responses to mandated seat belt laws.
Hazardous Perceptions

Despite statistics showing a decrease in traffic-related fatalities because of seat belt laws, almost 55 percent of those we polled told us they believed that wearing a seat belt could actually be dangerous in some situations.
Additionally, nearly 36 percent of participants told us they knew someone who was safer during a situation because they weren’t wearing their seat belt. About 17 percent told us they were unsure if someone may have been safer not wearing their safety belt.
While the benefits of wearing a seat belt during a car accident are unquestionable, some minor injuries may be sustained when the belt restrains the body during impact. Minor injuries to the abdomen, neck, and lumbar spine have been reported over the years in severe crashes. However, these injuries pale in comparison to the devastating effects of going without during a serious crash. This can come with the ultimate price: one’s life.
Situational Awareness

When we asked participants how important it was to wear a seat belt in certain situations, we found it was very important for them to wear one as a front seat passenger.
As well, participants considered it important to wear a seat belt if they were only traveling a couple of miles or in the early morning with hardly any other cars on the road. This demonstrates that even during casual driving, many recognize the immense safety benefits of wearing a safety restraint at all times.
Participants were less concerned about wearing a seat belt when they used a ride-hailing service, such as Uber or Lyft, or when they were passengers in a taxi. Interestingly, survey respondents did not consider it equally important for a child to wear a seat belt on a school bus. While legislation on seat belts for large school buses is usually left to state and local authorities, research has shown that installing seat belts on these buses might not have additional safety benefits. In instances involving fire or water, seat belts may even exacerbate accidents and fatalities.
Child Safety Laws

As with most other laws regarding seat belts, child safety laws are a matter of state jurisdiction. While booster and car seats are mandated, and children between certain ages are required to wear seat belts at all times, the exact ages for these laws vary in each state.
When we asked survey participants at which ages children should still be required to travel in a car seat, we received wildly different answers. Some (6.4 percent) responded that only children 2 years old and younger should be required to ride in a car seat, while others told us that a child between the ages of 10 and 12 should still utilize additional safety protection. The largest response – 35.4 percent – said children 6 years old and younger should travel in a car seat.
Because these additional precautions can save lives, the American Academy of Pediatrics recommends that children at least four years of age ride in a car safety seat up to the highest weight or height allowed by the manufacturer. Additionally, children should use a booster seat until at least 8 years old or until the traditional seat belt fits correctly. It is also recommended that children under the age of 13 ride in the back seat at all times.
Seat Belt Summary
Buckling up should be like second nature. Countless research on the subject shows the benefits of wearing a seat belt when involved in a motor vehicle accident. Thankfully, over 90 percent of Americans always wear their seat belts in the car.
While laws on the issue can vary significantly from state to state, nearly all require passengers in the front seat to be safely restrained at all times. Many have instituted primary seat belt laws. These allow law enforcement officers to issue a traffic citation to anyone found without a seat belt on – without any other traffic offense taking place.
Like seat belts, car insurance is also very much a part of life on the road. CheapCarInsurance.net helps you compare custom-tailored rate plans from online insurance providers to find the cheapest way to save on your car insurance. For your free and customized comparison quote, visit us today.
Methodology
We surveyed more than 2,000 people about how often they use a seat belt and their feelings about vehicle safety laws. We also pulled data from the CDC’s Behavioral Risk Factor Surveillance System (BRFSS) about seatbelt usage of Americans by age, race, and state. All data regarding child seat laws were taken from Insurance Institute for Highway Safety (IIHS).
Fair Use Statement
If you would like to the spread the message, please share our content for noncommercial purposes only. All we ask is that our drivers (or authors of this page) are given proper credit. Buckle up and enjoy the ride.
 If you have a young driver on your insurance policy, you know that can be an expensive proposition. Young drivers cost more to insure because, mile-for-mile, they get into more accidents. So it’s smart to ask yourself, “How will a child going to college affect my car insurance?”
Having a child leave for college is a huge milestone, with both emotional and practical impacts. One of the latter type may be changes to your car insurance premium.
The implications could range from nonexistent to substantial, with rates going up, down or staying the same, depending on such factors as where the young person will be living, whether a car is going along and even how good a student your child is.
So, before you load up your child’s clothes, bedding and laptop, read up on the factors that could impact your car insurance premiums.
You may be surprised by what you learn.
Will my child going to college affect my car insurance negatively?
If your son or daughter has their own car, it is very important to let your insurance company know if the car will be at school or left home, as the cost of the insurance will be based on where the car resides, the Insurance Information Institute advises.
Location is a major factor affecting car insurance premiums. Within the same state, different areas have higher or lower rates of accidents, thefts, weather damage and other hazards, and insurers adjust rates accordingly.
MORE: Will a Bad Roommate Drive Up the Cost of My Insurance?
This could work for you or against you. If your student is going to a rural university, you might pay less, because rates tend to be lower in rural areas. Conversely, the heavier traffic, narrower streets and higher theft rates in cities generally translate to higher premiums.
In other words, Iowa State University is good, but New York University isn’t, at least when it comes to car insurance rates. So, the first thing to consider when wondering how a child going to college affects my car insurance is location.
Across state lines, these same factors apply, plus each state’s varying requirements over such things as how much liability protection drivers must buy and which other coverages they must have. For instance, drivers in Iowa must maintain liability coverage for $20,000 in injuries per person and $40,000 per accident, plus $15,000 in property damage. In neighboring Illinois the requirement is $25,000 in injuries per person and $50,000 per accident, plus $20,000 in property damage, along with uninsured- and underinsured-motorist coverage, according to the Insurance Information Institute.
You don’t need to worry about another state’s insurance requirements when you’re simply visiting or driving through. But going to college in another state means living there, so you’ll need to contact an insurance company to find out how how a child going to college affects car insurance.
MORE: Should You Wait Until Age 18 to Get a Driver’s License?
If your student was already the primary driver of the car, the premium could go up or down, depending on the specific circumstances. If your child will become the primary driver or is getting a new vehicle, expect to pay more.
Daily commute to campus can affect insurance
 If your child will be living at home while going to school, consider whether this means a change in driving habits. A daily commute to and from campus, for instance, might be a different type of vehicle use and mean more miles driven per year.
Or it could mean less if your family lives close to campus.
These are factors insurers considers when setting premiums, so it’s important to let yours know about such changes.
Be direct and ask your agent, “How does my child going to college affect my car insurance?”
No car at college can save most on insurance
If your child isn’t taking a car to college, you don’t have to do anything. But you might be able to save some money on your car insurance premiums.
“If the student has been driving the family car and will now be away at college, at least 100 miles from home, make sure you let your insurance company know,” the Insurance Information Institute advises. “You may be eligible for a discount on your auto insurance.”
Your child can still drive the family car during the occasional visit home.
Qualify for car insurance savings with good grades
Finally, you should be able to save on car insurance if your college student gets good grades. Statistics show that young drivers who do well in school tend to get into fewer accidents.
These discounts vary by insurer. Students generally must maintain at least a “B” average, or meet another mark of achievement, such as making the dean’s list.
Be truthful with insurance company about college plans
As explained above, your child going to college could be good or bad for your car insurance rates, or have no impact whatsoever. No matter which of these is the case for you, it’s important, as always, to be open and honest with your insurance company.
After an accident, your insurer will look into the circumstances to ensure it is actually liable for the claim. Lying or neglecting to inform your insurer of important information could leave you and your child on the hook for injury and damage costs.

Many people are passionate about speed, whether dizzying roller coasters or fast motorcycles. But for some drivers, this need for speed manifests in a dangerous and illegal way: street racing. This underground subculture draws participants and onlookers across the country. Fueled by adrenaline and competitive spirit, drivers race and drift (purposely oversteer to perform fishtail-style stunts). Some compete for money; others race for glory. Unfortunately, these races risk the safety of vehicle occupants, onlookers and passersby.
Participants often turn to social media to share photos and videos of their exploits and announce upcoming races. That’s why we decided to analyze 161,400 Instagram posts with hashtags related to the illicit hobby: #streetrace, #streeto, #streetdrift, #streetracing, #streetoutlaws and #1320. We also surveyed more than 1,000 people to get their take on the topic and examined data about street racing fatalities from the National Highway Traffic Safety Administration’s Fatality Analysis Reporting System (FARS).
How do Americans feel about street racing? Which parts of the country see the most deaths from this illicit pastime? Which cities and states are street racing hotspots? Which months and days do people most frequently post on social media about it? And how do feelings about racing compare across the country? We’ve got the inside track on the world of street racing.
Feelings About Street Racing

Street racing has been around for decades, but in recent years, the street racing scene has exploded. It’s been partly fueled by movies such as “The Fast and the Furious.” (The eighth in the series of action movies will hit theaters in 2017.) In 2013, Discovery Channel even debuted a documentary called “Street Outlaws,” propelling the subject even more into the mainstream.
But how often do races truly occur? According to our survey, more than half of men and nearly four in 10 women in the United States have seen an illegal drag race. Additionally, around a quarter of men and almost 9 percent of women say they’ve actually been a driver or dropped the flag.
Surprisingly, only slightly more than half of people say they don’t condone street racing. In fact, nearly four in 10 say they’d be willing to participate in some way, whether as a spectator or driver. If our respondents stumbled upon an illegal race, nearly 56 percent say they’d stick around to watch, however, they’d report it to authorities.
The Deadliest States for Street Racing

While the actual number of street racing deaths is relatively low compared with some other fatality statistics, the fact is that these deaths are preventable. Among every state in the nation, Louisiana has the highest rate of fatalities related to illegal street racing. A recent news article compared the street racing scene in Shreveport, Louisiana, to “a scene straight out of ‘The Fast and the Furious’ movies.” One driver there admitted to reaching speeds as high as 166 mph.
Nevada has the second-highest rate of street racing deaths – indeed, Reno and Las Vegas have both struggled with the issue. These communities are particularly vulnerable: In these 24-hour entertainment hubs, people drive to and from work around the clock. Street racers seeking empty stretches of road are likely to encounter fellow drivers even into the wee hours.
South Dakota claims third place for deaths. In recent years, police in Sioux Falls, South Dakota, have seen an uptick in races and recently spearheaded a campaign to reduce unsafe driving practices, such as racing and reckless driving. Delaware, Nebraska and Colorado also have higher-than-average fatality rates related to illegal drag races.
The nationwide death toll from street racing may be even higher than the data reveal; however, it can be difficult for officials to accurately track related fatalities if no witnesses come forward.
Street Racing Instagram Posts
The map above tracks the density of street racing posts on Instagram. As you can see, post volume is heavier in major cities. Seattle, Los Angeles, San Francisco and Denver dominate in the West. (L.A. is actually the origin of “The Fast and the Furious” film.) On the other coast, Boston, New York and D.C. stand out. Chicago, Dallas, Houston, Atlanta and Miami are also hotspots for these racing-related Instagram hashtags.
States Where Street Racing Reigns

When it comes to talking street racing on social, Oklahoma far and away claims the top spot. Instagrammers there share just more than 11 street racing posts per 100,000 residents. The state is home to a unique street racing event: Once a year, the city of El Reno hosts an event called “Small Town Weekend” that features the country’s only legal street race down Highway 66. Though the race takes place under police supervision, last year one driver was involved in a terrible crash (fortunately, he was not injured). Illegal races occur in Oklahoma as well. In 2015, street racers were caught on camera in Edmond and Oklahoma City traveling as fast as 200 mph.
Nevada ranks second for street racing Instagram posts. As mentioned above, entertainment hotspots Reno and Las Vegas also draw adrenaline-fueled drag racers. In hopes of curbing illegal races in Vegas, officials urge drivers to attend safe and legal alternatives, such as “Midnight Mayhem” at the Las Vegas Motor Speedway. Numerous street racing Instagram posts also originate from Indiana (particularly Indianapolis), as well as North Dakota, Texas, Florida and California.
Popular Cities for Street Racing

Next, we zoomed in on specific cities with high rates of Instagram posts about drag racing. Though cities in Florida dominate the list, Sugar Land, Texas, shoots to the head of the pack. The city is a suburb of Houston, which has long struggled with a thriving illegal racing scene, with competitors gathering in empty parking lots and racing all over the city. Aliso Viejo, California, a city in Orange County, takes second place for street racing posts on Instagram. Racers in the area tend to be on the young side, officials have said, and the events are often small ones that don’t draw crowds.
Indianapolis takes third place. Home to the Indianapolis Motor Speedway, Indiana is known as the racing capital of the world. However, it appears the passion for speed does not stop where the law ends. In 2015, a race between a Mustang and a Corvette in Indianapolis killed three people, including a 12-year-old girl.
Fourth-place Ocala, Florida, hosts the annual WannaGOFAST event: a “safe and controlled” street race on a drag strip. However, illegal street races also plague the city. Finishing the top five is Bowling Green, Kentucky, where residents come by their love of fast cars naturally: The city is home to the National Corvette Museum Motorsports Park and Beech Bend Raceway. Along with a handful of cities in Florida, Long Beach, California, and Coppell, Texas, also rev up Instagram feeds with numerous racing posts.
Top Months and Days for Illegal Races

Officials in numerous states point to warmer weather as a factor in beckoning racers to the streets. Indeed, Instagram race posts skyrocket in March, April and May. However, relatively scant posts appear in summer – June, in particular, sees the fewest street racing posts of any month.
Instagram posts about racing remain fairly steady throughout the week. Race photos appear in Insta feeds most frequently on Sundays and Tuesdays, followed by Mondays and Saturdays. Although it’s likely many street races occur on weekends, some participants may share Instagram posts both before and after the events.
Common Times for Illicit Racing

A clear trend emerges when examining the time of day Instagrammers post street racing images. These missives crescendo in the evening, at nightfall, and in the wee hours of the morning, hitting peaks around rush hour and again at 1 a.m. and 2 a.m. Posts then drop dramatically in the morning hours between 6 a.m. and noon.
It’s clear that both street racing posts and actual street races generally occur during the evening and early hours of the morning. While some might picture a secret rendezvous taking place during the witching hour, police in Las Vegas noted that street races do not necessarily occur in the middle of the night – and an empty road at 7 p.m. is just as likely to beckon participants.
Instagram Sentiment Toward Street Racing, by State

Tracking the number of “likes” that Instagram posts receive can help paint a picture of general sentiment toward the subject. Along with claiming first place for these posts, Instagrammers in Oklahoma by far outpace the rest of the country when it comes to double-tapping them.
Oklahoma actually inspired the Discovery Channel Show “Street Outlaws,” which chronicles the lives of street races. Though it focuses on Oklahoma City, scenes are apparently filmed across Oklahoma, including in Tulsa. Although billed as a reality show, “Street Outlaws” itself notes that the races occur “within a controlled environment with strict safety protocols in place.”
Many states where Instagram users “like” posts most frequently are also the origin of a higher-than-average number of posts, such as Nevada, Texas, Indiana and North Dakota. Clearly, a love of automobiles and speed can be ingrained in the culture of a state.
Conclusion
Legal automobile racing can be a fun, exciting and positive experience for both participants and fans; illegal street racing, on the other hand, can terrorize residents, injure innocent people and claim lives. Any driver who does not adhere to speed limits is taking a massive risk – after all, hidden crosswalks, blind corners and pedestrian-heavy areas may not be obvious until it’s too late.
In a personal essay for RoadandTrack.com, former street racer Jack Baruth notes that participants are drawn to the subculture for various reasons: “Maybe they watched a movie that glorifies street racing. Maybe they have friends who do it. Or maybe they are simply listening to a voice within that tells them to go out and see what you’re made of,” he writes. His chilling prediction: “As an activity, street racing has little going for it. If you stick with it long enough, you’ll wind up dead or in jail.”
You may hear a street race before you see it due to the telltale sounds of motors revving and brakes screeching. Though your top priority should be to steer clear of danger, you should call the police to report the incident when it’s safe to do so. If possible, take note of the direction the car is traveling; the make, model and license plate; and the driver’s appearance. Even if racers have left the area, it’s still important to contact authorities. Pinpointing the exact location can help law enforcement track racing hotspots and ramp up patrols in the area in hopes of putting the brakes on this dangerous practice.
Methodology
We analyzed 161,400 Instagram posts with street racing–related hashtags and included #streetrace, #streeto, #streetdrift, #streetracing, #streetoutlaws and #1320. For our “What Do Americans Think of Street Racing” graphic, we conducted a survey of 1,006 people, and for our “Which States Have the Most Dangerous Street Racing Scenes: Based on the Number of Fatalities in Street Racing Crashes,” we analyzed the most recent NHTSA Fatality Analysis Reporting System data.
Sources
- http://www.roadandtrack.com/car-culture/features/a26101/illegal-street-racing-wont-go-away/
- http://www.latimes.com/local/lanow/la-me-ln-street-racing-popularity-20160229-story.html
- http://www.roadandtrack.com/car-culture/entertainment/a29234/everything-we-know-about-fast-and-furious-8/
- http://www.imdb.com/title/tt3027156/
- http://www.ksla.com/story/31154406/fast-and-furious-illegal-street-racing-in-shreveport
- http://www.ktvn.com/story/26224367/police-illegal-street-racing-calls-increase-in-south-reno
- http://www.reviewjournal.com/view/paradise/street-racing-breaks-laws-endangers-drivers-and-community
- http://www.kdlt.com/news/local-news/police-expect-increase-in-street-racing/38555880
- http://www.businessinsider.com/illegal-street-racing-in-los-angeles-2013-5
- http://www.dragzine.com/news/video-racer-unhurt-in-brutal-legal-street-racing-crash-in-oklahoma/
- http://www.koco.com/news/street-racing-caught-on-camera-in-edmond/34088664
- http://memory.loc.gov/diglib/legacies/loc.afc.afc-legacies.200002999/
- http://fox59.com/2015/12/24/one-person-dead-several-others-injured-south-side-accident/
- http://www.wannagofast.com/
- http://www.ocala.com/article/20090126/articles/901260269
- http://www.motorsportspark.org/
- http://www.visitbgky.com/listings/beech-bend-raceway/117/
- http://www.newson6.com/story/26001326/officials-closing-tulsa-road-for-illegal-street-racing
- http://www.kdlt.com/news/local-news/police-expect-increase-in-street-racing/38555880

First, the good news: In the United States, car theft has been declining steadily for the past decade. Still, a motor vehicle is stolen every 46 seconds – a number that isn’t very comforting. So how safe is your car?
To find out, we looked at data from the FBI and the National Insurance Crime Bureau. We mined it to discover which cars are most likely to be stolen and where. What we found might surprise you.
The Riskiest Places to Park Your Car

When it comes to car theft, not all states are created equal. According to the FBI and the U.S. Department of Transportation, Washington, D.C., is the riskiest place to park. Although the District of Columbia is not technically a state, we’ll treat it as such. Its average of 17.5 thefts per 1,000 registered vehicles is significant enough to include in our ranking.
Significantly lower (but still risky) are Washington, California and Nevada, all averaging between 10 and 11 thefts per 1,000 registered cars.
On the other end of the spectrum, Vermont and New Hampshire are the safest states to park that sedan, with just 1 and 1.5 thefts per 1,000 vehicles, respectively.

Of course, if risk varies state by state, it also makes sense that it varies by city. According to the National Insurance Crime Bureau, the most dangerous communities to leave your car are the California cities of Modesto and Bakersfield, as well as Albuquerque, New Mexico, each with thousands of vehicle thefts reported in 2015.
Live in California? It isn’t just Modesto and Bakersfield you have to watch out for. Turns out, eight of the riskiest cities on our list are in the Golden State.
America’s Most Frequently Stolen Cars

Whether you’re driving through the Vermont countryside or parked in San Francisco, some cars are bigger targets than others.
According to our research, thieves favor 1990s-model cars, perhaps because engine immobilizer systems in new cars make it essentially impossible to start a car without the ignition key. These system started to become widespread in 1998. Modern cars can still be stolen, but now it takes a much higher level of technical sophistication.

The make and model of your vehicle can also make it a target. Nationally, Honda Accords are the most desirable cars to steal, followed by Honda Civics and full-size Ford pickups. But thieves’ preferences vary a bit by state.
In Alaska and a large swath of the Midwest, Chevy pickups are the most stolen vehicle. In D.C., Illinois, Wisconsin, Maryland and Ohio? It’s the Dodge Caravan. And in Michigan, Chevrolet Impalas are the most likely to be boosted.
The Most Stolen Car in Each State

Mapping One Year of Car Theft in Four Major Cities
So what does all this theft look like? And where exactly is it happening in your city? We mapped “grand larceny of a motor vehicle” across four major U.S. cities to find out. As you might expect, some parts of town are bigger hot spots for auto crime than others. According to our New York and Chicago maps, however, grand theft auto can really happen anywhere.

The Odds of Justice
If your car is stolen, what is the likelihood that you’ll get it back and the perpetrator will be caught? Although it would seem that cracking the case should be easier in the age of GPS, the reality is that these crimes are still difficult to solve. Nationally, fewer than 15 percent of vehicle thefts end with someone in handcuffs. That is partly because many stolen cars are quickly taken across international borders by organized rings of thieves.

According to the FBI, the odds of an arrest are best in the East South Central part of the country, where more than 22 percent of car thefts result in arrest. And the worst odds? They’re found in the Pacific region, where fewer than 9 percent of car thieves are eventually arrested – a fact that might account for the higher crime levels in California and Washington.
Now, the Good News

Don’t forget, car theft has been declining steadily for 10 years. In 2003, there were more than 433 car thefts per 100,000 people. Today, that number is closer to 215 – a roughly 50 percent drop. So while we still have a way to go to ensure our rides are totally secure, the truth is that they’re safer than they’ve ever been before.
Conclusion
When it comes to car theft, the good news is clear: Our vehicles are about 50 percent safer today than they were 10 years ago. We also know a lot about car theft and can use that knowledge to our advantage.
Thinking about buying a car from the 1990s or early 2000s? Now you know that the 2001 model is a safer bet than the 1997 model. If you’re in a high-risk city, now you know to take extra precautions, like parking your car in a garage, purchasing a steering wheel club (which often causes would-be thieves to move on) and using a car-tracking service.
And of course, the most important thing is to have good affordable insurance – just in case.
Fair Use
If you’re interested in using the images from this project, please feel free to do so. We simply ask that you attribute CheapCarInsurance.net for the content, and provide a link back to this page, so your readers can learn more about our work.
Sources
- http://www.consumerreports.org/cro/magazine/2014/09/how-your-car-is-tracking-you/index.htm
- http://www.nytimes.com/2014/08/12/upshot/heres-why-stealing-cars-went-out-of-fashion.html
- https://ucr.fbi.gov/crime-in-the-u.s/2014/crime-in-the-u.s.-2014/tables/table-26
- https://data.cityofnewyork.us/Public-Safety/NYPD-7-Major-Felony-Incident-Map/dvh8-u7es
- http://shq.lasdnews.net/CrimeStats/CAASS/desc.html
- https://data.cityofchicago.org/Public-Safety/Crimes-2001-to-present/ijzp-q8t2]
- https://data.seattle.gov/Public-Safety/Seattle-Police-Department-911-Incident-Response/3k2p-39jp?category=Public-Safety&view_name=Seattle-Police-Department-911-Incident-Response
- https://www.nicb.org/newsroom/news_archive/2005-hot-wheels
- http://www.interpol.int/Crime-areas/Vehicle-crime/Vehicle-crime
- https://www.nicb.org/theft_and_fraud_awareness/top-vehicles-stolen-by-state
- https://www.fhwa.dot.gov/policyinformation/statistics/2014/mv1.cfm
Methodology
We launched this project by ranking states based on car thefts per 1,000 registered vehicles rather than per capita. That’s because some states, particularly those featuring dense urban areas and good public transit, have lower rates of car ownership than others. New York only has 26.1 registered vehicles per 100 people, whereas Alabama has twice as many with 52.1 registered vehicles per 100 people.
We also wanted to identify the top metro areas for car thefts; however, we had to take a slightly different approach because vehicles are registered by state governments, not cities. To rank metro areas, we had to calculate the number of car thefts per 100,000 residents.
To understand which cars were most likely to be stolen and where, we analyzed and mapped National Insurance Crime Bureau data, which covered more than 650,000 vehicle thefts nationwide. This revealed that older model cars were most likely to be stolen, although there has been a recent uptick in thefts of new vehicles.
We also used public crime data from law enforcement agencies in Los Angeles, New York, Chicago, and Seattle to visualize every motor vehicle theft in those cities in 2015. The cities were not selected because of their rates of theft but rather because they are among America’s most populous metropolitan areas, and they have excellent public data sets.

Let’s see if you can answer this question without Google: How do you jumpstart a car?
While we live in a world where information and instruction are just a few taps or voice commands away, there’s something to be said about knowing the inner workings of our automobiles. Unfortunately, though, our mechanical troubleshooting skills don’t seem to be improving.
Auto dealers and repair shops looking to recruit qualified employees are facing a shortage of skilled car mechanics, and there have been several stories of schools placing auto shop classes into the scrap heap.
Interested to see how car-competent America truly is, we surveyed more than 2,000 people on their automotive IQ. How confident are they when it comes to changing a tire? And do they even know how to check the oil? Should we look to older generations when it comes to knowing the difference between an AC compressor and alternator? To see what we found, drive on through.
Our Automotive Report Card

Not only did we ask individuals to rate their personal knowledge and comfort surrounding a variety of different repairs in our survey, but we also used a quiz to gain a general understanding of America’s current car competence. Did they know what a transmission actually does? Can they identify a part with just a photo? What do they do when water gets in their gas tank? These are just a few examples of the questions we asked.
Only two regions ended up with a score above 80 percent. Respondents from East South Central – Alabama, Kentucky, Mississippi, and Tennessee – earned the highest marks with their car knowledge. The recorded average scores from these states were just shy of 83 percent. Arkansas, Louisiana, Oklahoma, and Texas (also known as West South Central) used their grease monkey skills to score a close second with an equally impressive 80 percent.
Coming in last were those respondents from the Middle Atlantic region – New Jersey, New York, and Pennsylvania – who answered barely over 75 percent correctly. This becomes even scarier when you consider that, out of the 50 states, each one of these appears in the top 10 when looking at the number of cars in each state.
New York ranks fourth overall in terms of automobiles on the road, behind only California, Texas and Florida. Before you blame it all on taxi cabs, realize there’s around 13,400 in New York City. With more than 5 million cars cruising through the Empire State, perhaps it’s past high time to help educate their citizens on automotive care and concern.
Listen to Your Elders

While hopping online to find a “how to change my oil” video that might make sense, maybe a parent or grandparent should be your first resource instead. Male baby boomers, born between 1946 and 1964, scored the highest in our assessment of auto know-how at just more than 91 percent. They displayed the ability to discern between a spark plug and an alternator without much issue.
Our youngest millennials, however, showed this is one area they might not be as comfortable as they would have you think. Scoring almost 20 percentage points lower than male baby boomers, young millennial men concede this point to those growing up around the original Mini Cooper, Ford Mustang and Porsche 911. With the advent of digital ride-booking services, such as Lyft or Uber, it puts our youngest millennials in a position where even owning a car seems unnecessary. If you’re never playing the part of a driver, would you even think about starting to learn how a car works or the steps to repair it?
Fake It Till You Make It

Confidence, when not equipped with knowledge, comes off as foolish rather than informed. This happened in New England, where respondents self-assessed with the highest level of car confidence among those surveyed, but actually ranked fourth across all regions in our test. West North Central aligned their confidence closer to their actual results; they said they were the least confident and scored the second lowest average across all the regions.
We asked the participants just how uncomfortable or comfortable they were with a smattering of different tasks often associated with operating a car. This ran the gamut from parallel parking to driving a vehicle with manual transmission. Perhaps this is even more difficult for millennials – lessons such as these would be taught in a driver’s education class, but those are becoming harder to find in schools.
For example, in just one decade, California’s Orange County Public Schools went from offering the course in 33 schools to six, supporting almost 2,000 students in 1998 to 162 in 2012.
Tired of Oil Changes

Digging deeper into the confidence on specific tasks, we found not all automotive chores are created equal. More than 40 percent of those surveyed indicated they were completely confident in their ability to replace a flat tire. When combined with those who were somewhat confident, this represented nearly 60 percent of participants. With just more than 20 percent who noted they were clueless on the steps, it’s possible a few people on your epic road trip know how to change that flat you’ll pick up in the middle of nowhere. (Let’s just hope the spare tire is in great shape!)
Almost 60 percent acknowledged they were clueless or not very confident when it comes to an oil change. Given that extensive operation of a car without an oil change can result in engine deposits with terribly high levels of iron, aluminum and chromium, whether they learn to replace it themselves or not isn’t the real issue. Just getting the oil changed, and often, seems more important.
Stick It to ’Em

Even though there are large numbers of cars for sale that still operate with a manual transmission, only 10 percent of vehicles manufactured in the United States during 2014 were equipped with a manual. Given the dwindling number of cars currently being built with anything other than an automatic transmission, is it any surprise that almost 50 percent of younger millennials and almost 40 percent of older millennials are clueless with a clutch?
This isn’t the only auto scenario they’re ill-equipped for. They’re also going to struggle with handling an overheated car. Adding water to the radiator is a delicate task – you don’t want to end up with burns in the process. A third of young millennials would be asking for help in this situation. Baby boomers were extremely confident with more than 60 percent saying they could handle this task.
Name That Part

Yes, you know where the lever is to open your hood. But if you opened it, would you actually know what you’re looking at. What’s under each part’s guard? When seeing if those surveyed could just do that, we showed them photos of an AC compressor, alternator, drive shaft and rotor and asked them to label that part. Close to 75 percent correctly identified the alternator, and more than 50 percent properly pointed out the drive shaft and the rotor. Where they struggled was making out the AC compressor. It definitely isn’t the coolest of answers to miss.
Treading Lightly With Tech

When you’re buying a new car, bells and whistles can make the difference between feeling good and great about your purchase. However, almost half of those tech features the dealership sold you on may go unused within the first 90 days. Maybe it included the nearly 20 percent of baby boomers who have no confidence when it comes to connecting their phone to the car’s speakers, either with Bluetooth or an auxiliary cable.
They’re also the group who claimed the most concern about being able to use the navigation system. In stark contrast to baby boomers, 85 percent of millennials indicated they were completely confident when it came to using their GPS system. Here’s a great chance for those young and older millennials to trade some favors – providing technical support in exchange for guidance on telling them how to jumpstart a car in a moment of need.
Who Are You Gonna Call?

More than 36 percent of those surveyed indicated the first call they’d make when they’re stranded with their car is to roadside assistance. AAA arms more than 56 million members with roadside assistance solutions. Aided with additional protection from their car manufacturers (in fact, nearly every major car company offers some type of plan to new car buyers), it makes sense that this would be the first call.
For a different take on who to call first, younger millennials overwhelming preferred to make mom or dad the first choice; almost 45 percent thought their parents would be the best option when they’re experiencing a car crisis. And if you’re a Gen Xer, you’re most likely to call your significant other, or AAA.
Future of Our Auto Identity
Now, we have a much better understanding of what Americans do or don’t know about operating and caring for their motor vehicle. When it comes to knowing how to identify car parts or operate a stick shift, we’ve seen that there’s more than a fair amount of information for younger millennials, men and women, to absorb.
Their first call (or perhaps a text message) when smoke starts pouring out of their engine most likely goes to their parents. If that parent happens to be a male baby boomer these kids are in luck – they performed the best in our technical assessment. While every car needs routine maintenance, you should also ensure you’ve locked in the best deal for car insurance. CheapCarInsurance.net provides a comprehensive overview of the best auto insurance deals available for you.
Sources
- http://usatoday30.usatoday.com/money/autos/story/2012-08-28/shortage-of-auto-mechanics-looms/57414464/1
- https://www.fhwa.dot.gov/policyinformation/statistics/2014/mv1.cfm
- http://www.nyc.gov/html/tlc/downloads/pdf/2014_taxicab_fact_book.pdf
- http://www.chicagotribune.com/classified/automotive/ct-american-car-culture-hits-skids-with-millennials-20150911-story.html
- http://www.usnews.com/education/blogs/high-school-notes/2011/09/19/two-thirds-of-teen-drivers-dont-know-basic-auto-repair
- http://newsroom.aaa.com/about-aaa/aaa-fact-sheet/
- http://www.edmunds.com/auto-warranty/warranty-and-roadside-assistance-coverage.html
- http://www.latimes.com/business/autos/la-fi-hy-jdpower-consumers-car-technology-20150824-story.html
- https://www.thrillist.com/cars/every-car-sold-in-the-united-states-with-a-manual-transmission
Fair Use Statement
You can use all the images above freely, but don’t drive away without linking back to this study. Give credit where credit is due.

If you’re a college student needing car insurance while on campus, or a parent who needs insurance coverage for a child away at school, it’s smart to understand the costs of car insurance for college students and how to find the best deal.
The typical college student looking for car insurance may already be at a disadvantage.
A 2016 study by CarGurus.com puts the average cost of car insurance for “young adults” at approximately $2,000 – although many college-age kids way underestimated that cost.
According to the survey, 25 percent of the young adults surveyed believe car insurance will cost $250 or less per year, while another 28 percent put the cost at $500.
But there’s more than cost to consider when it comes to car insurance for college students.
To get a better handle on the topic, we asked several leading experts what steps they would take to get the best, most comprehensive and affordable car insurance policy.
Here’s what they said should be priorities in the insurance-buying process for college students.
Check your family’s car insurance policy
Check to determine eligibility for coverage under the parents’ policy because this provides the best opportunity to maximize protection at the most reasonable price.
MORE: Why Your Teen’s Brain Isn’t Ready to Drive
“If the student has possession of a car and will be living in student housing or an apartment for the school year, they are still considered a member of the family household and can remain on the household (i.e., parents’) auto insurance policy,” says Carol Anderson, assistant vice president for underwriting at MetLife Auto & Home. “But if the student is making a permanent relocation, they would need to purchase their own auto insurance policy. This vehicle and driver would be removed from the household insurance policy, which may result in a premium reduction for the parents.”

 Car insurance for college students on a family policy

Anderson advises students and parents to notify the insurance company if the student isn’t taking a car to college.
“If the student is not taking a vehicle to school, the household auto insurance policy may be eligible for discounts,” Anderson says. “The student would still be a covered driver when using a household vehicle during school breaks and other trips home.”
Focus on car insurance discounts
A good insurance representative can assist a student in learning about insurance and determining the right amount of coverage.
“During the quote process, the student should also ask about discounts for which they might be eligible,” Anderson adds. “Many companies provide discounts for things like good grades (at least a 3.0 grade average should do the trick), safe driving and pledging not to text and drive.”
Personal car insurance for college students
Brandt Minnich, vice president of sales at Mercury Insurance in Orange County, California, advises parents and guardians of college students to “know what they need to protect” with a college-aged son or daughter.
“This means you not only have to consider your college student’s car, but also your own assets,” Minnich says. “If you are supporting the student and the car is in your name then you could be liable if the student gets into an accident, so have enough liability coverage to protect you and your assets.”
Minnich also advises considering the value of the student’s vehicle.
“If the vehicle isn’t worth at least four to five times the cost of the premium, then it probably doesn’t make sense to keep comprehensive and collision coverage,” he points out.
Find a car insurance expert
It’s always a smart idea to work with an agent. Car insurance is a pretty complicated purchase and you want to make sure you are getting the right coverage at the best possible price.
MORE: 25 Tips for Finding Cheap Car Insurance
“An agent can help you get the right coverage and explain what is and isn’t covered when it comes to your student,” Minnich says. “Based upon your needs and your budget, they can offer different solutions tailored to your college student’s situation.”
Don’t lend your car to college friends
Lending your car means you are also lending out your insurance. Caution students on letting others drive their vehicle and discourage communal use. If needed, have the keys stored in a private place.
Store car insurance documents safely
College students are infamous for their ability to forget key personal items, such as house keys, phone chargers and bank cards. That’s not good, but a worse offense is not having quick access to car insurance documentation in the event of an accident or traffic stop.
“Make sure your student stores all of the documents they need in one secure location in their vehicle and on their person,” says Elsabeth Hepworth, an insurance specialist with TrueNorth Insurance in Cedar Rapids, Iowa.“The student should be able to locate their auto identification cards and emergency phone numbers at a moment’s notice and ensure that they are all up to date.”
Before they leave, prepare an easily accessible list of phone numbers for roadside assistance and claims, so that your student has them on hand in the event of an accident or loss.
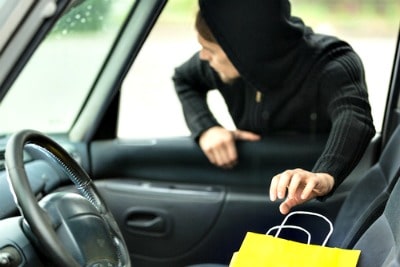
Deterring theft helps lower insurance costs
Make sure that your student understands the importance of keeping all valuables out of sight in unattended vehicles — and always remember to lock the car.
With more students toting laptops to class, it’s important to make sure that if they are not on your student’s person, they are somewhere safe.
Add students to your family insurance policy
The biggest mistake is when parents allow a child to use a vehicle, but do not add them as listed drivers on the policy, says Thomas J. Simeone, a personal injury attorney at Simeone & Miller, LLP, in Washington, D.C.
“Parents do this to avoid a premium increase, but it’s a huge risk,” he says. “That’s because if the child causes an accident, the insurance company may deny coverage.”
Moreover, in some jurisdictions the parent can be sued in addition to the child – even if the child’s driving had nothing to do with the parent – simply because the parent owns the car. If that happens and the insurance company denies coverage, the parent will also be liable and that is a bigger problem because they likely have more significant assets than a student.
Bad driving record? No car at college
If a student has a bad driving record — loaded with speeding tickets and an accident or two — the parent or guardian should re-think allowing the child to drive the car.
“The parent can be liable for negligent entrustment if the child causes injuries and the parent is found to have entrusted the car to a known bad driver,” Simeone adds. “Again, this makes the parent liable, which can be more risky than a child. And, at the very least, a parent should increase their liability coverage to the maximum allowed and consider an umbrella policy, which is affordable and offers an additional $1 million or more of liability protection.”
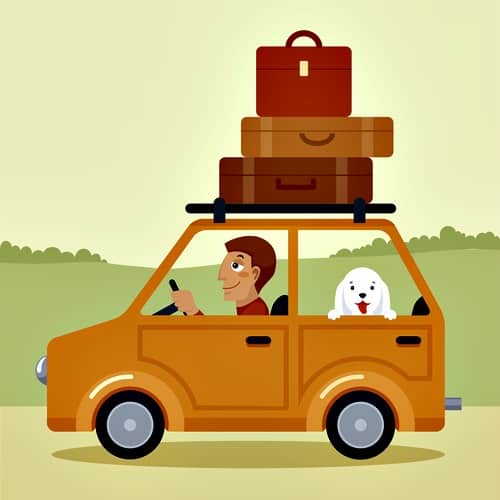 Ever wonder what might happen to your car if it were caught in the middle of a riot? Or what if a meteorite descended from space and landed on your hood while driving to visit the in-laws?
Well, there’s good news for drivers who may encounter these and other strange circumstances — auto insurance just might come to the rescue.
Sure, when most of us buy car insurance we probably do so thinking it will help ease the financial burden of repairing our vehicle after an accident.
But most comprehensive auto policies actually cover a whole lot more than mere repairs, including everything from reimbursing lost wages to paying for acupuncture therapy, pet injuries and even damage caused by sneaky rodents.
Now keep in mind that every individual auto policy is different, and there’s no guarantee every insurer will cover every circumstance listed below. Nonetheless, here are six lesser-known instances where drivers can take advantage of the outer limits of car insurance coverage.
Injuries to pets
While not commonly thought of as accident victims, your pets can get injured in a car accident just as easily as their human counterparts. And treating our pets for injuries is anything but cheap, which is why some policies now include coverage that can help with the medical costs and recovery of your four-legged friends.
MORE: 25 Tips for Finding Cheap Car Insurance
“Many companies are now starting to offer accident coverage for your pets,” says Nick Braun, an independent insurance agent. “The basic idea is that if you get into an accident and your pet needs emergency care or surgery, it’s going to be covered under your auto policy. It’s becoming a popular add-on and can be a real life saver if your dog or cat suffers injuries.”
Braun says most auto insurers don’t charge extra for pet coverage in a comprehensive policy and the typical coverage limit is between $1,000 and $2,000. There’s just one catch: most policies will only provide coverage if the accident was not your fault.

 Rodent damage

Whether you keep your car in a garage, in your driveway, or parked on the street, rodents have a maddening ability to get inside and cause substantial damage.
And whether they’ve chewed up some of the wiring, made a nest of important documents in the glove box, or left behind pellet-sized reminders of their presence, the damage can wind up costing a substantial amount of money.
According to California-based insurance agent Jeremy Schaedler, drivers should look for a clause in their policy that includes the phrase “other than collision” to find out whether or not an insurer will cover the cost of damage left behind by mice, rats, squirrels or rabbits.
“This is a very common question for folks out here in California,” Schaedler says. “For instance, a very common thing out there is damage from mice chewing on a car’s electrical wires. And the damage from that can be surprisingly expensive.”
Lost wages
Even minor accidents can lead to injuries that prevent us from going to work. But if you find yourself laid up following an accident, you may not have to worry about the money you’ll lose by staying home and healing.
The key to recovering lost wages after an accident is making sure you have Personal Injury Protection (PIP) on your auto policy. In short, PIP is an extension added to your car insurance that not only covers lost wages, but also a wide range of medical expenses, including acupuncture and physical therapy.
MORE: How to Avoid Being an Insurance Scam Victim
Justin Elsner, a Washington-based attorney who specializes in insurance, says the extent of PIP coverage will vary from state to state.
“For example, drivers with PIP in Washington can be compensated for lost wages, medical bills, funeral benefits, and even essential services like paying someone to mow your lawn or clean your house while you’re physically unable,” Elsner says. “Talk to your insurance agent about what PIP benefits apply to your state.”

 Riots
Riots

It may sound like a far-fetched scenario for many, but getting caught in the middle of extreme civil unrest can potentially wreak havoc on your vehicle.
“If your car is in the wrong place at the wrong time during a riot or demonstration, some plans offer coverage for any damage that occurs as a result,” says Wayne Cohen, a Washington, D.C., attorney who specializes in automotive law. “Of course every policy is different and coverage is going to vary, so find out what sort of riot damage is covered before you find yourself in the middle of one.”
Falling objects
Whether it’s golf-balled-sized hail, a swiftly descending bird, a meteorite, or a piece of jet engine broken lose in mid-air, most comprehensive auto policies will pay for any damage sustained from falling objects.
According to the Insurance Information Institute, “If a satellite, meteor or asteroid falls on your car, coverage is provided under the optional comprehensive portion of an auto insurance policy.
“And if falling debris causes an auto accident, the liability portion of the policy would come into play.”
Rental cars and roadside assistance
Braun says most insurers will offer both roadside assistance and rental car reimbursement for a small additional fee.
“Towing and roadside assistance usually cost an additional $25 to $50 per year, and rental coverage costs an additional $20 to $75 per month, depending on the type of vehicle you want to rent,” Braun says. “So if you own an Escalade and want to rent an Escalade while your car is getting repaired, that’s going to be closer to $75 a month. But if you total your car and need a rental for a long period of time, it’s money well spent.”
